New to Rust? Grab our free Rust for Beginners eBook Get it free →
A Beginner’s Guide to Styling Pandas DataFrame (Including Styler.To_Excel)
Python provides umpteen features to customise the visualisation of the data that is being analysed. In this article, we shall explore in great depth one such function that aids in the styling of the data in the MS Excel spreadsheet. A styler object is a high-potential tool that could be deployed for formatting the DataFrame, rendering a compelling facade that might not seem like a spreadsheet anymore. So let us get started with knowing how to bend MS Excel to our desire using the styler from Python.
Also Read: Python Data Types – Easily Explained!
Introduction to Styling
An accessor needs to be put into use for utilising the styling properties for the pandas DataFrame to its fullest potential. It also supports modifying the styler object which is primarily used to control the different ways in which a DataFrame is displayed.
Given below are the various types of styling that can be incorporated into a spreadsheet using the styler option in Python programming:
- Highlight Minimum Values
- Highlight Maximum Values
- Highlight Null Values
- Colour Table Borders & Data
- Truncating the Decimals Displayed
- Hide the Index Column
- Style Writing a Spreadsheet
Highlight Minimum Values
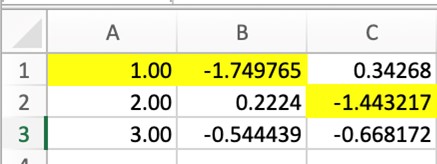
In order to highlight the minimum values in the given spreadsheet data, the below code is deployed.
df.style.highlight_min()
Given below is an example in which the minimum values of each column are highlighted.
Highlighting Maximum Values
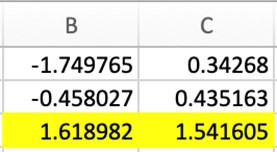
Now that we have highlighted the minimum values, let us now replace the min with max in the code in order to get the maximum values of the given dataset highlighted.
df.style.highlight_max()
Given below is an example in which the maximum values of each column are highlighted.
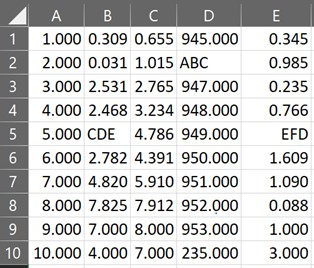
Highlight Null Values
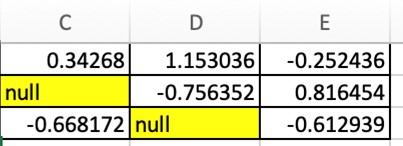
With the maximum and minimum values being taken care of, one might wonder whether there is a way to visualise the locations in which null values are present in the given dataset, should there be any. This very thought leads us to the following code which highlights the null values as shown below.
df.style.highlight_null()
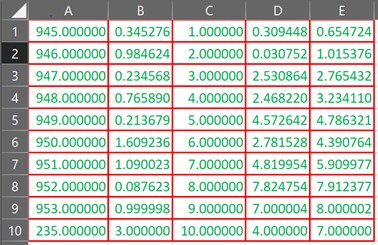
Colour Table Borders & Data
The DataFrames displayed as an output using Python compilers such as the Jupyter Notebook, for instance, are generally rendered by using HTML and CSS. Therefore it seems a no-brainer to tweak the data visualisation using the set_properties function along with the styler object as demonstrated in the code given below.
df.style.set_properties(**{'border': '1.3px solid red', 'color': 'green'})
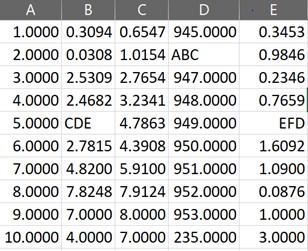
Truncating the Decimals Displayed
At times one might be dealing with decimals in the dataset with each entry having its own count of decimal digits. To set things in order, one can deploy the styler object along with the set_precision function to standardise the decimal places in all the entries as shown below.
df.style.set_precision(3)
Hide the Index Column
The very first column in a DataFrame shall be its index which works very well as a reference but not in all cases. Thus, during times of necessity, the below code is put to use to make the index column disappear.
df.style.hide_index()
Style Writing a Spreadsheet
Enough of tweaking the output in compilers like the Jupyter Notebook, to make the real thing happen, choose any of the above modifications or even better, all of it and use the to.excel( ) function to embed all the selected modifications into the data in an MS Excel spreadsheet as shown below.
df.style.highlight_min().set_properties(**{'border': '1.3px solid red','color': 'green'}). set_precision(3).to_excel('File.xlsx', engine = 'openpyxl')
Conclusion
Now that we have reached the end of this article, hope it has elaborated on the techniques to use the styler function combined with the to_excel( ) function for editing the style of the contents within an Excel spreadsheet. Here is another article that details how to use numpy positive in Python. There are numerous other enjoyable and equally informative articles in CodeforGeek that might be of great help to those who are looking to level up in Python.
Reference
https://pythonbasics.org/write-excel/