New to Rust? Grab our free Rust for Beginners eBook Get it free →
How to group by dataframe in pandas with groupby(), agg and transform


Say you’ve got a sales CSV with a city column and a hundred thousand rows, and someone asks for the total per city. Looping over the DataFrame row by row would work, but it’s slow and easy to get wrong. Pandas’ groupby() method handles this instead: split the rows into buckets by city, run a calculation on each bucket, then combine the results back into one DataFrame or Series. This guide covers the syntax, plus agg(), named aggregation, and transform().
How to group by dataframe pandas (split-apply-combine)
Every groupby operation in pandas breaks down into three steps. First, pandas splits the DataFrame into smaller pieces based on the values in one or more columns. Second, it applies a function to each piece on its own, whether that is a sum, a custom lambda, or a ranking. Third, it combines the results back into a single object.
The groupby() call itself does none of this work right away. It builds a lazy DataFrameGroupBy object that only runs the split when you call a method like .sum(), .agg(), or .transform() on it. This matters because you can chain several operations on the same grouped object without recomputing the split each time.
Syntax of pandas groupby() method
Pandas groupby() method is a key feature for performing split-apply-combine operations on DataFrames. One can understand the workings of the Pandas groupby() method through its syntax which is given below. It contains all the basic constituents required for its effective functioning.
Syntax:
DataFrame.groupby(by=None, axis=0, level=None, as_index=True, sort=True, group_keys=True, squeeze=False, observed=False)
Parameters:
- by (mapping, function, label, or list): Specifies the criteria for grouping. It can be a column name, a function, or a list of criteria.
- axis (int, default 0): Specifies whether to group along rows (0) or columns (1).
- level (int, level name, or sequence of such, default None): For DataFrames with multi-level index, this parameter specifies the level to use for grouping.
- as_index (bool, default True): If True, the group labels will be used as the index in the result.
- sort (bool, default True): Specifies whether to sort the resulting groups by group labels.
- group_keys (bool, default True): If True, add group keys to the index to identify each original index.
- squeeze (bool, default False): If the grouped data is a single group, return the data as a Series.
- observed (bool, default False): This parameter is used when the grouping information is categorical. If True, only show observed values for categorical groupers.
Groupby() parameters in current pandas versions
The signature above matches older pandas releases. A few of those parameters have since changed, and knowing the current defaults saves you from chasing a TypeError on a fresh install.
- axis is gone. Recent pandas always groups along rows, so pass a transposed DataFrame if you truly need to group columns instead.
- squeeze is gone too. It was deprecated for years before removal, so drop it from any code you copy from older tutorials.
- observed now defaults to
Truefor categorical groupers, the reverse of the old default. Set it toFalseonly if you want every category to appear in the result, even ones with zero rows. - dropna defaults to
Trueand controls whether rows with a missing group key get their own “NaN” group or get dropped entirely.
Current syntax looks like this:
DataFrame.groupby(by=None, level=None, as_index=True, sort=True,
                   group_keys=True, observed=True, dropna=True)
Implementation of pandas groupby() method
After knowing the syntax and the parameters of the groupby() method, let’s move on to implementing it. For implementing groupby() method let’s first create a DataFrame.
import pandas as pd
df = pd.read_csv("weather_by_cities.csv")
df
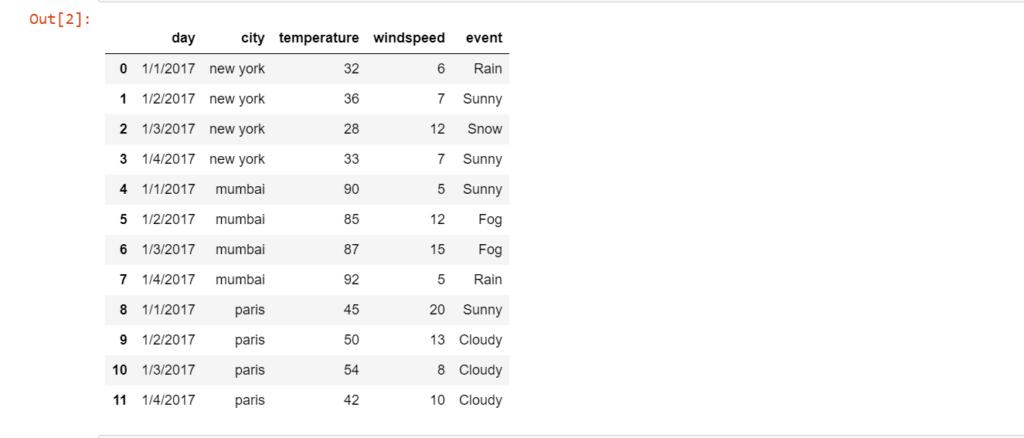
Here we first imported the Pandas as pd, then created the DataFrame using a CSV file, the CSV file name is weather_by_cities.csv, and then printed the DataFrame.
Output:
Let’s see how to use groupby() method in different scenarios on the above-created DataFrame.
Using pandas groupby() with single column
As we know the pandas groupby() method is used to split and segregate some parts of data from the DataFrame by passing specific conditions into it. So here we will be grouping the DataFrame by passing a single column into it.
g = df.groupby('city')
g.first()
Here we have passed ‘city’ column inside the groupby() method which splits our original DataFrame ‘df’ and created a new DataFrame where all the data belongs to the ‘city’ column.
Output:

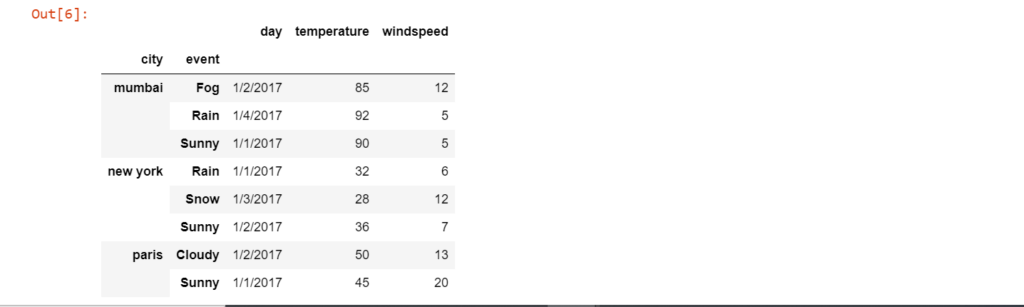
Using pandas groupby() with multiple columns
In this section, the only difference with the last section is that instead of grouping our data based on a single column, we will pass more than one column.
g = df.groupby(['city','event'])
g.first()
Output:
Selecting group using get_group() method
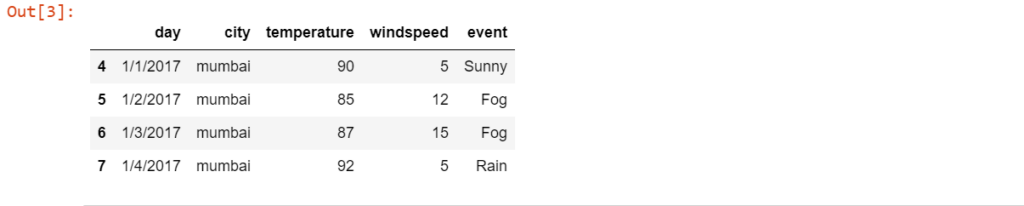
Apart from splitting the data based on a specific column, we can also access a specific group from the DataFrame by using the get_group() method.
g = df.groupby('city')
g.get_group('mumbai')
Here we first grouped the data based on the ‘city’ column and saved the resultant DataFrame in variable g. Then we have written g.get_group(‘mumbai’) which helps us to access the data belonging to the mumbai in the DataFrame g.
Output:
Analyzing group using describe() method
The describe() method will give us various statistics like mean, count, standard deviation, etc.
g = df.groupby('city')
g.describe()
Output:

Plotting graphs for group using plot() method
Let’s plot some graphs, for this, we will first write %matplotlib inline which helps the Python environment to draw the plots immediately after the current cell. After that, we will use the plot() method for plotting graphs.
g = df.groupby('city')
%matplotlib inline
g.plot()
Output:
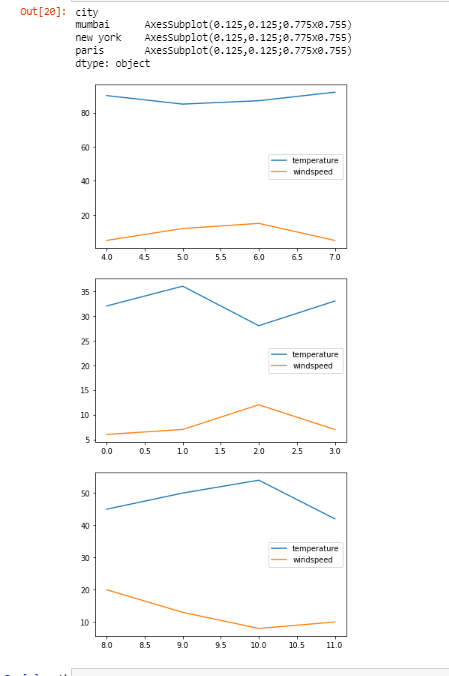
After calling the plot() method, we got three different plots that correspond to the temperature and windspeed in each of the cities. The first plot is for ‘mumbai’, the second is for ‘new york’ and the third is for ‘paris’.
Aggregating groups with agg()
The .agg() method (also called .aggregate()) lets you run several summary statistics on a grouped DataFrame in one call, instead of writing a separate line for each function. This is the fastest path to answers like “total sales and average order size per city.”
import pandas as pd

df = pd.DataFrame({
    'city': ['mumbai', 'mumbai', 'delhi', 'delhi', 'pune'],
    'sales': [1200, 1500, 900, 1100, 700],
    'units': [12, 15, 9, 11, 7]
})

city_group = df.groupby('city')
city_group.agg(['sum', 'mean'])
Passing a dictionary lets you apply a different function to each column, which is common when one column needs a total and another needs a mean:
city_group.agg({
    'sales': 'sum',
    'units': 'mean'
})
You can also pass a custom lambda inside .agg() for a calculation that has no built-in method, such as the range between the highest and lowest sale in a group:
city_group['sales'].agg(lambda x: x.max() - x.min())
.agg() accepts string aliases (“sum”, “mean”, “count”), a list of them, a dict mapping columns to functions, or any callable. Built-in strings run faster than a lambda because pandas has optimized, Cython-based versions of common aggregations.
Named aggregation for cleaner output columns
Passing a list or dict to .agg() often produces a DataFrame with a confusing hierarchical column index. Named aggregation fixes this by letting you name each output column directly, using the column, aggfunc tuple syntax.
result = df.groupby('city').agg(
    total_sales=('sales', 'sum'),
    avg_units=('units', 'mean'),
    order_count=('sales', 'count')
)
print(result)
Each keyword argument becomes a plain column name in the result, with no MultiIndex to flatten afterward. pd.NamedAgg('sales', 'sum') is the same as the plain tuple ('sales', 'sum'). Use whichever reads clearer in your code, since pandas treats both the same way.
This pattern is worth defaulting to any time you group by more than one statistic, since it saves a reset_index() and a manual column rename later.
Transforming groups with transform()
Aggregation reduces each group down to one row. Transformation keeps the original shape of the DataFrame and fills in a value calculated from each row’s group. This is the tool for adding a new column back into your original data, like a rank or a normalized score.
Ranking rows within a group
df['sales_rank'] = df.groupby('city')['sales'].transform(
    lambda x: x.rank(ascending=False)
)
print(df)
Every row keeps its rank relative to the other rows in the same city, so you can add a new column without losing the original row count.
Normalizing values within a group
A common transform is a group-wise z-score, which standardizes each value against its own group’s mean and standard deviation instead of the whole dataset:
df['sales_zscore'] = df.groupby('city')['sales'].transform(
    lambda x: (x - x.mean()) / x.std()
)
Filling missing values with the group mean
transform() also handles imputation cleanly, since it broadcasts a group statistic back to every row in that group:
df['sales_filled'] = df.groupby('city')['sales'].transform(
    lambda x: x.fillna(x.mean())
)
Built-in aggregation strings like 'mean' or 'sum' also work directly inside .transform(), and pandas broadcasts the single group result across every row automatically. Reach for the string form first, since it runs faster than an equivalent lambda.
Filtering groups with filter()
Aggregation and transformation both keep every group. Filtration drops entire groups based on a group-level condition, which is useful for removing small or low-value segments before further analysis.
big_cities = df.groupby('city').filter(lambda x: x['sales'].sum() > 2000)
print(big_cities)
The lambda receives the whole sub-DataFrame for one group and must return True or False. Groups where it returns False are dropped entirely, and the rows that remain keep their original index. This differs from .query(), which works on individual rows rather than whole groups. If you want row-level conditions instead of group-level ones, pandas’ query method is usually the simpler tool.
Controlling group output with as_index and sort
Two parameters change the shape of a groupby result without changing the underlying calculation.
as_index=False pushes the grouped column back into a regular column instead of the index, which mimics the SQL-style output most people expect from a GROUP BY:
df.groupby('city', as_index=False)['sales'].sum()
sort=False skips sorting the group keys and keeps them in the order they first appear in the data. On a large DataFrame this can give a meaningful speedup, since sorting is one of the more expensive parts of the split step.
df.groupby('city', sort=False)['sales'].sum()
Iterating through a groupby object
A DataFrameGroupBy object is iterable, which makes it a useful way to inspect what the split step actually produced before deciding on an aggregation.
for city, group in df.groupby('city'):
    print(f"Group: {city}")
    print(group)
Each iteration hands you the group’s key and the matching sub-DataFrame as a tuple. This is mainly a debugging tool, since looping in Python is far slower than a built-in aggregation on the full grouped object.
Handling missing values in group keys
When the column you group by contains NaN, pandas drops those rows from the result by default. Pass dropna=False to keep them as their own group instead:
df_with_na = df.copy()
df_with_na.loc[0, 'city'] = None

df_with_na.groupby('city', dropna=False)['sales'].sum()
This matters most in real datasets pulled from a CSV or an API, where a missing category can quietly disappear from a report unless you check for it. If you would rather clean the column before grouping, pandas’ replace method is a common way to fill in a placeholder category first.
Performance tips for groupby on large datasets
A few habits keep groupby fast once a DataFrame grows past a few hundred thousand rows.
- Select only the columns you need before grouping, since
df[['city', 'sales']].groupby('city')processes far less data than grouping the full DataFrame. - Convert the grouping column to a categorical dtype with
astype('category')when it has a small number of repeated values. This can cut memory usage and speed up the split step. - Prefer built-in aggregation strings such as
'sum'or'mean'over a lambda, since pandas runs the built-in versions in optimized Cython code rather than a plain Python loop. - Set
sort=Falsewhen the order of the output groups does not matter to your analysis. - If you are grouping data pulled from several sources, combine them first rather than running a separate groupby on each piece and merging the results afterward.
Key takeaways
- groupby() follows split-apply-combine and returns a lazy object until you call a method on it
- agg() runs multiple summary statistics in one call, using strings, lambdas, or a dict per column
- Named aggregation gives output columns clean names without a MultiIndex to flatten
- transform() returns a result the same shape as the input, ideal for ranks, z-scores, and filling NaNs
- filter() drops whole groups based on a group-level condition, unlike row-level filtering
- as_index=False gives SQL-style output with the group column restored
- dropna=False keeps rows with a missing group key instead of silently dropping them
- Categorical dtypes and built-in aggregation strings both speed up groupby on large data
Frequently asked questions
What does groupby dataframe pandas actually do?
It splits a DataFrame into groups based on one or more columns, runs a function on each group, and combines the results into a new DataFrame or Series.
What is the difference between agg() and transform()?
agg() reduces each group to a single summary value, while transform() returns a result with the same number of rows as the original group.
How do I group by multiple columns in pandas?
Pass a list of column names to groupby(), such as df.groupby([‘city’, ‘event’]), and pandas creates one group per distinct combination.
Why does my groupby result have a MultiIndex?
Aggregating with multiple functions or multiple columns creates a hierarchical column index by default. Named aggregation avoids this by naming each output column directly.
How do I keep NaN values as their own group?
Pass dropna=False to groupby(), since the default behavior drops rows where the group key is missing.
Is groupby().apply() slower than built-in aggregations?
Yes, in most cases. Built-in methods like sum() and mean() use optimized Cython code, while apply() runs a Python loop under the hood.
Can I filter out entire groups instead of individual rows?
Yes, the filter() method takes a function that returns True or False for each group and keeps only the groups that pass.
Conclusion
Grouping data is one of the most common steps in a pandas workflow, and knowing when to reach for agg(), transform(), or filter() saves a lot of manual looping. Start with the built-in string aliases, and only drop into a custom lambda when a calculation truly has no built-in equivalent.