New to Rust? Grab our free Rust for Beginners eBook Get it free →
Application Performance Monitoring in Kubernetes: Best Practices and Tools

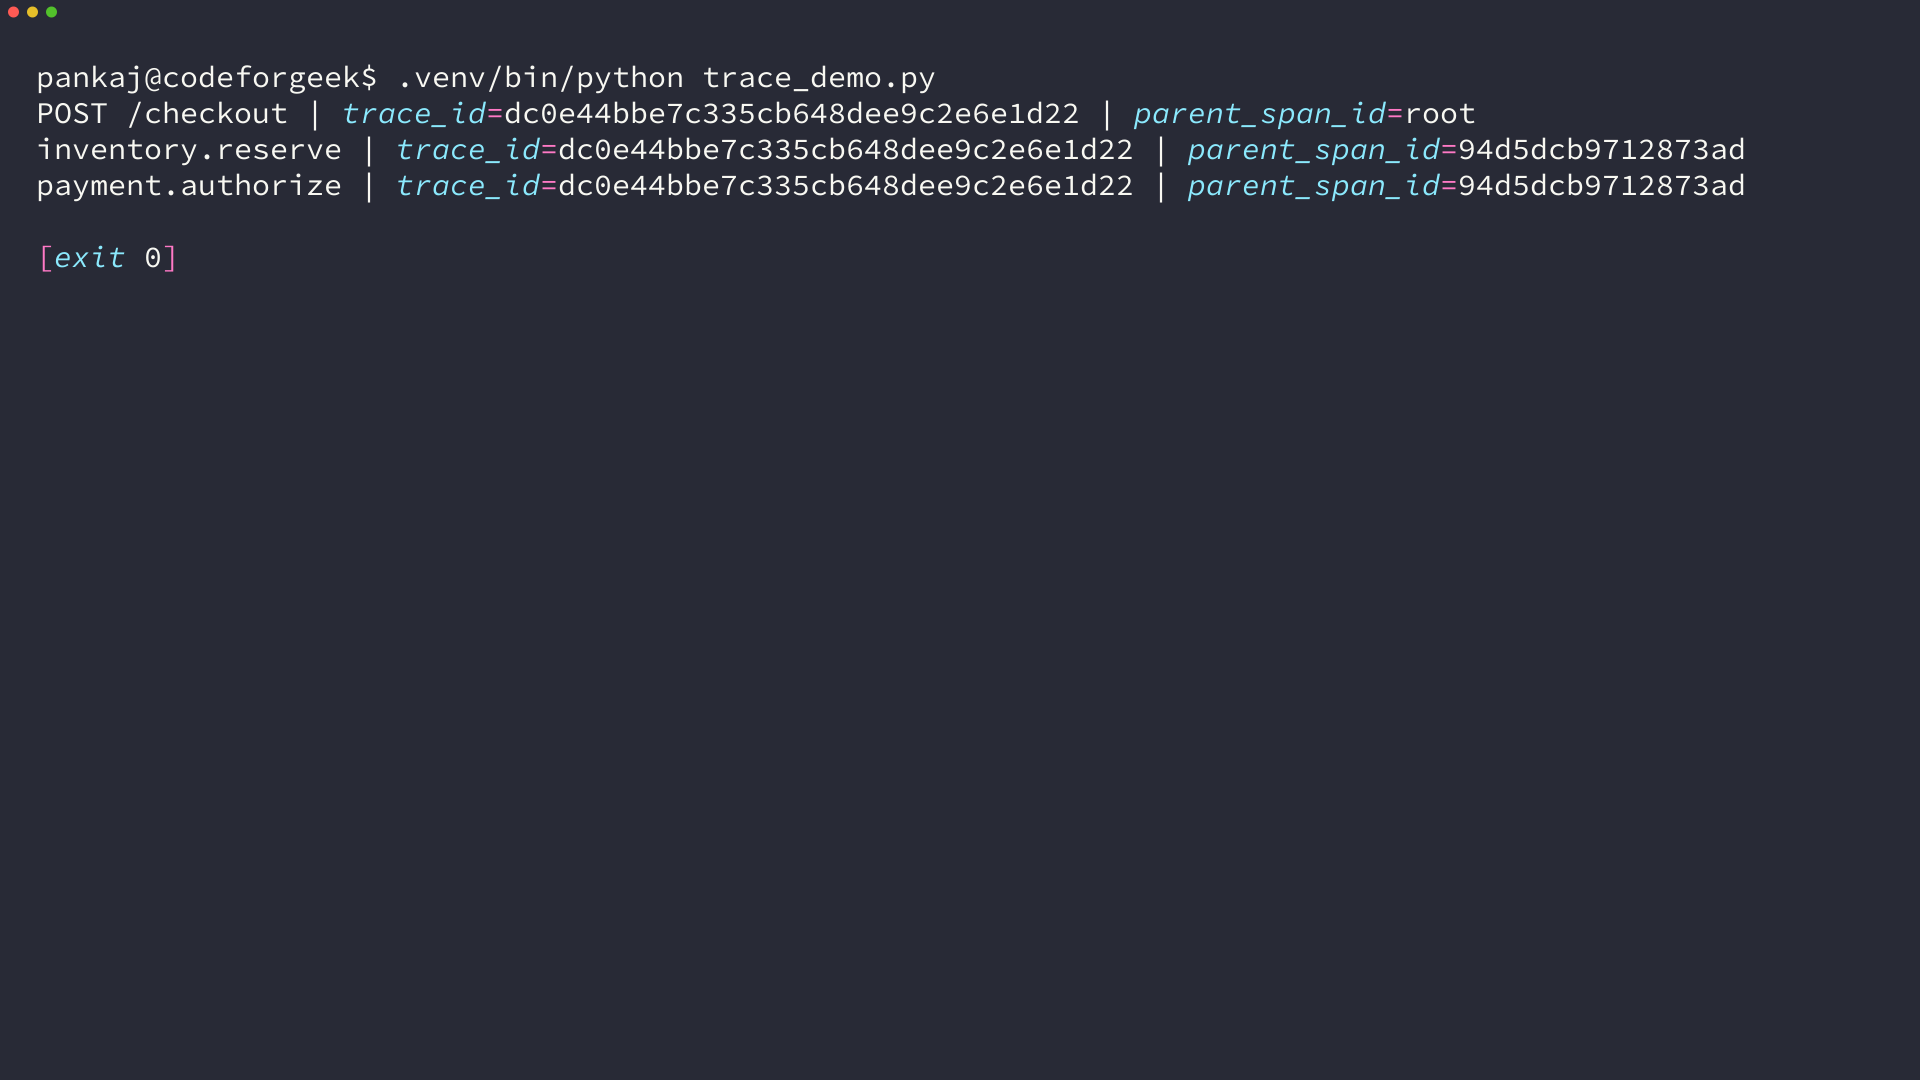
A single trace identifier appears on the checkout span and both of its children in the local output. I find that detail compelling because it keeps the request’s separate operations tied together.
Connect a nested delay with the Kubernetes workload behind the request. Compare request behavior with workload resource measurements to place that delay in context.
Application performance monitoring reads the request, not the Pod
Application performance monitoring (APM) measures request success and duration from the caller’s view. Kubernetes resource metrics report central processing unit (CPU) use and memory at the Pod or node level, and application telemetry identifies the code path behind a request.
metrics-server collects a limited set of node and Pod resource measurements and exposes them through the Kubernetes Metrics application programming interface (API), which kubectl top and the Horizontal Pod Autoscaler consume. A readiness probe marks a Pod ready to receive Service traffic. Track request latency separately to see whether calls meet their objective.
| Question | Kubernetes resource view | Application view |
|---|---|---|
| Is the workload available? | Pod readiness and restarts | Request success rate and errors |
| Is a route slow? | CPU and memory use | Request latency and trace spans |
| Where is capacity tight? | Node and container resources | Queue depth or connection-pool pressure |
For example, a checkout request can wait on a database call while its Pod remains ready and its CPU stays within its limit. Use resource metrics to locate the workload and request telemetry to see the delay a caller experienced.
Identify the service before collecting signals
A stable service identity lets you compare traces across replicas. OpenTelemetry’s Kubernetes Attributes Processor can add namespace and Pod metadata to telemetry, but it needs Kubernetes API access and a working way to associate incoming data with a Pod.
- Set a stable service name and version on the telemetry resource so replicas group under one application.
- Propagate trace context across each Hypertext Transfer Protocol (HTTP) or remote procedure call (RPC) boundary so related spans share a trace identifier (trace ID) and parent relationship.
- Add namespace and Pod identity as resource attributes, and keep request IDs out of metric labels.
Prometheus recommends bounded label values because each unique label combination creates more time series. Its label guidance names user IDs and email addresses as dimensions to avoid.
Choose signals that describe the request
Google’s Site Reliability Engineering (SRE) book frames service monitoring around the signals that reveal request behavior and constrained capacity.
| Signal | Question it answers | Useful application view |
|---|---|---|
| Latency | How long do requests take, including the slow tail? | Duration histogram and percentile over a defined window |
| Traffic | How much work reaches the service? | Request rate by a bounded route or method |
| Errors | Which requests fail? | Failed request count and rate by status or error class |
| Saturation | Which resource is limiting work? | Queue depth or CPU throttling |
Alert on a user-visible symptom, such as a breach of a service-level objective (SLO), then use Pod restarts and CPU pressure to investigate the cause. Google’s SRE chapter recommends paging only for urgent, actionable conditions that affect users.
Because Prometheus stores histogram observations in buckets, histogram_quantile() estimates percentiles across replicas, with bucket boundaries influencing the result. Treat the result as an estimate, as the Prometheus histogram guidance explains.
Route telemetry through an OpenTelemetry Collector
OpenTelemetry traces follow a request from its root span through child spans that share a trace ID and name their parent, as the OpenTelemetry trace model describes.
An OpenTelemetry Collector receives application telemetry and exports it to a backend, while its Kubernetes Attributes Processor can add Pod and namespace context when API access and association rules are configured.
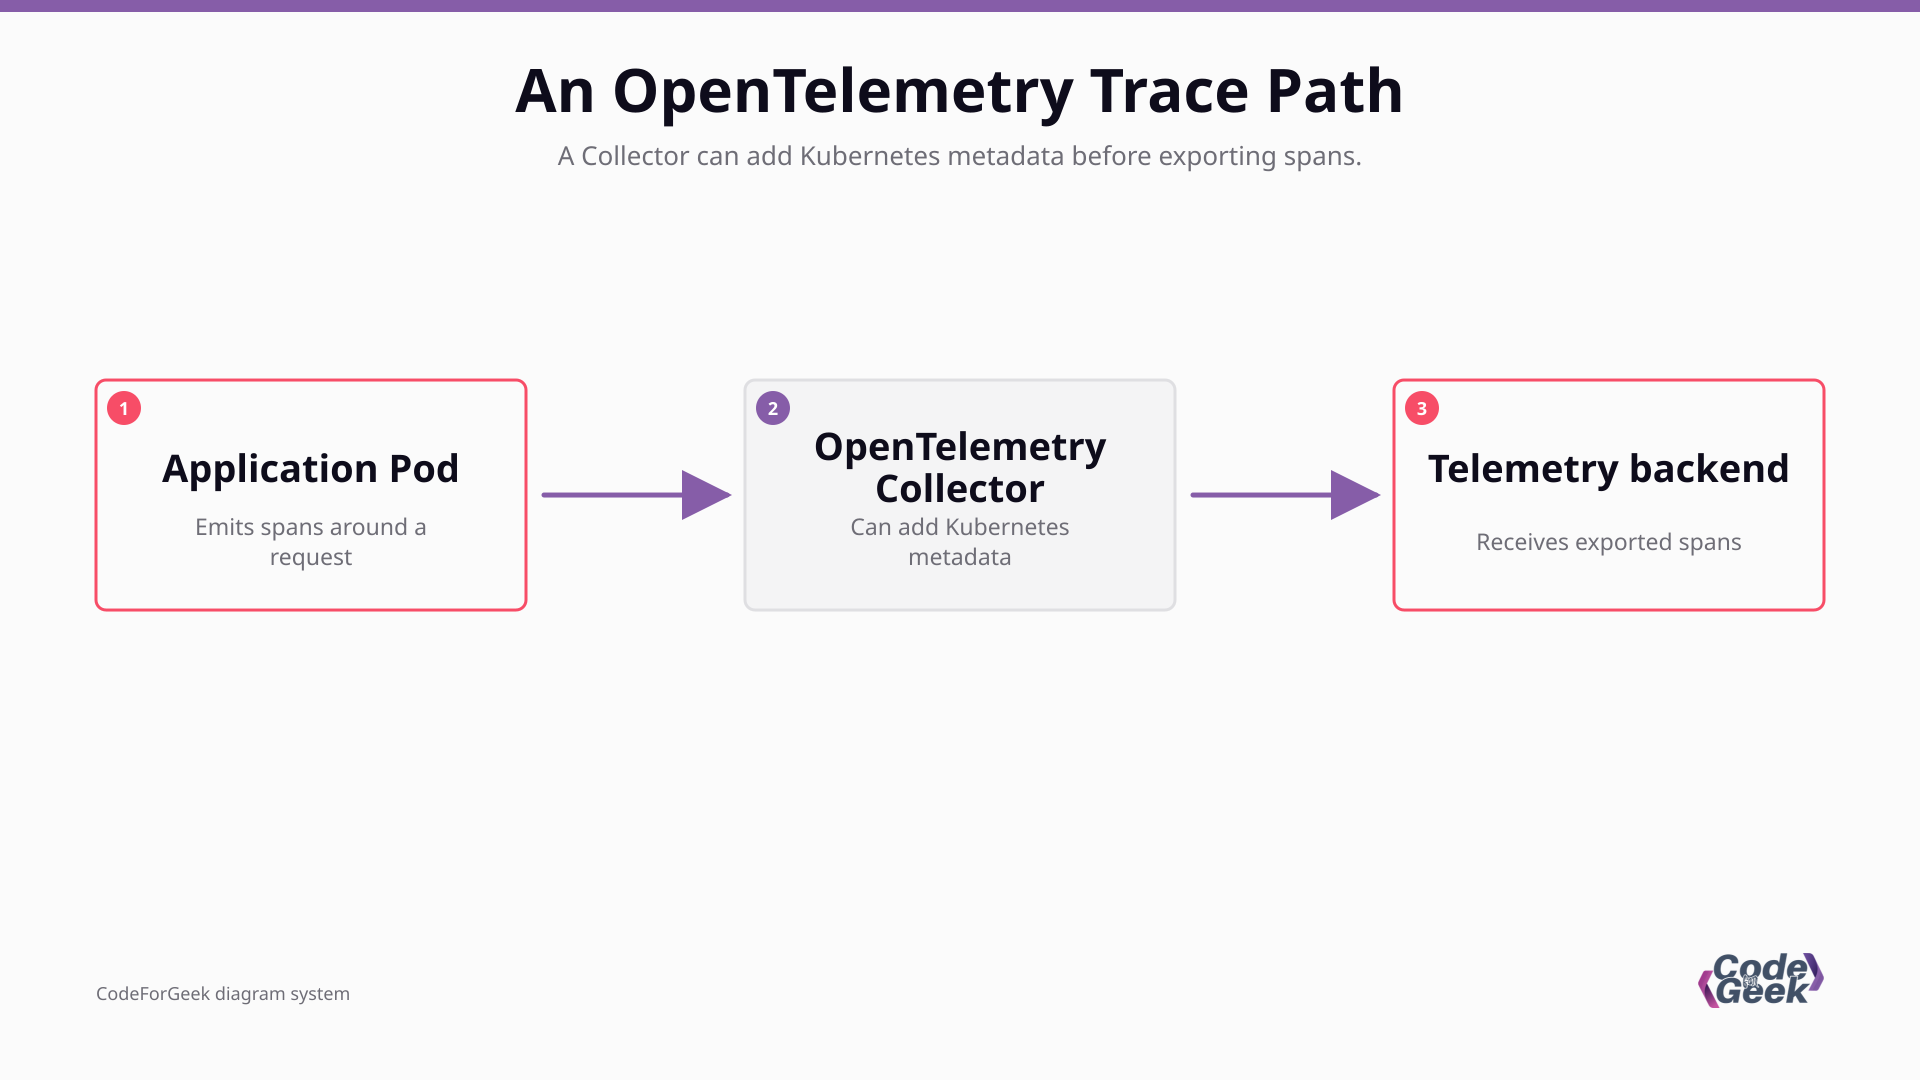
The Collector is optional, so an application can export directly to an OpenTelemetry Protocol (OTLP) endpoint. Put it in the path when you need a shared place to route and enrich telemetry, then keep that behavior explicit in its configuration.
Choose tools by data and operating cost
Choose a collection path by the signal you need and the work your team wants to own. A metrics backend cannot show a service call that the application never records.
| Approach | Data path | Fits when | Tradeoff |
|---|---|---|---|
| Prometheus with Grafana | Scraped metrics with PromQL queries and Grafana dashboards | You can operate a self-managed metrics stack | Tracing needs instrumentation and a trace backend |
| OpenTelemetry Software Development Kit (SDK) with Collector | Application spans and other configured signals exported through a Collector | You want portable instrumentation and control over routing | Your team maintains instrumentation and Collector capacity |
| Managed APM service | Vendor backend and interface for the data it ingests | You prefer a managed service view and its supported integrations | Review ingestion billing and retention first. Then check data access and export options |
Prometheus collects and evaluates metrics. Grafana visualizes the metrics you send it. If you need the time spent in a nested application call, add tracing instrumentation and a backend that can query those spans.
Diagnose a trace that never reaches the backend
When no traces appear, check the path from workload injection to export in order. Change one layer at a time so you can locate the first missing handoff.
- Deploy the OpenTelemetry Instrumentation resource before the application workload that uses it.
- Put the language-specific injection annotation under the Deployment’s Pod template metadata, and make sure it matches the application runtime.
- Match the exporter endpoint and protocol to a Collector receiver. The Operator documentation configures Python auto-instrumentation for OTLP over HTTP/protobuf, so the receiving Collector must accept that protocol.
- Confirm the Collector trace pipeline has an OTLP receiver and an exporter pointed at the intended backend.
- If spans arrive without namespace or Pod attributes, inspect Kubernetes API permissions and the Collector’s pod-association settings.
The Operator’s auto-instrumentation documentation calls out resource order, annotation placement, and endpoint configuration as troubleshooting checks. Its Kubernetes Attributes Processor documentation also explains that metadata enrichment depends on Kubernetes API permissions.
Run one request before widening instrumentation
This local sample lets you inspect parent and child spans without a Kubernetes cluster. Its named child operations are placeholders, and the in-memory exporter keeps the output local instead of sending telemetry to a backend.
python3.14 -m venv .venv
.venv/bin/python -m pip install opentelemetry-sdk
.venv/bin/python trace_demo.py
The script creates a root request span and two nested spans, then prints each span’s trace ID and parent ID from the SDK objects. The printed relationships show local trace context only, not Collector or backend delivery.
from opentelemetry import trace
from opentelemetry.sdk.resources import Resource
from opentelemetry.sdk.trace import TracerProvider
from opentelemetry.sdk.trace.export import SimpleSpanProcessor
from opentelemetry.sdk.trace.export.in_memory_span_exporter import InMemorySpanExporter

exporter = InMemorySpanExporter()
provider = TracerProvider(resource=Resource.create({"service.name": "checkout-api"}))
provider.add_span_processor(SimpleSpanProcessor(exporter))
trace.set_tracer_provider(provider)
tracer = trace.get_tracer("checkout")

with tracer.start_as_current_span("POST /checkout"):
    with tracer.start_as_current_span("inventory.reserve"):
        pass
    with tracer.start_as_current_span("payment.authorize"):
        pass

for span in sorted(exporter.get_finished_spans(), key=lambda item: item.parent is not None):
    parent = f"{span.parent.span_id:016x}" if span.parent else "root"
    print(f"{span.name} | trace_id={span.context.trace_id:032x} | parent_span_id={parent}")

provider.shutdown()
The root span has no parent ID. Each child span records the root span ID as its parent, and every span shares one trace ID that lets a backend group them when exported.
Once the local tree makes sense, point one instrumented service at the Collector and confirm the same trace carries the expected service and workload identity before collecting broadly.
What does application performance monitoring do in Kubernetes?
It connects request behavior to the Kubernetes workloads that handled each call. Resource metrics add cluster context, while traces show the path through instrumented operations.
Can a ready Kubernetes Pod still have slow requests?
Yes. A readiness probe reports whether a Pod can receive Service traffic, while application telemetry measures request success and duration.
Does OpenTelemetry require a Collector?
No. An application can export telemetry directly to an OTLP endpoint, while a Collector gives you a shared place to route and enrich signals.