
New to Rust? Grab our free Rust for Beginners eBook Get it free →
App Metrics That Matter: A Practical Guide


An app dashboard can show plenty of numbers without making clear whether users are getting value from the app. App metrics are defined measurements of technical behavior or user activity that help a team assess app health and product outcomes.
This guide explains how to choose app metrics and define them with clear events and time windows. It also shows how to connect each metric to a decision.
TL;DR: App Metrics to Track
Track a small set of app metrics that connects technical health, user behavior and business results to decisions your team can take.
- Monitor crash and ANR rates alongside startup time and network latency.
- Define activation, retention and conversion around named user events and time windows.
- Compare acquisition cost with customer value over the same cohort and period.
- Segment a change by app version, device, channel or cohort before choosing a fix.
What Are App Metrics?
An app metric is a defined measurement of technical behavior or user activity, such as crash-free sessions or users who finish onboarding. A key performance indicator (KPI) is a metric the team chooses to judge progress toward a product or business outcome.
Product analytics records user actions as events, then groups them by user, session or cohort. Firebase Analytics, for example, supports custom events and user properties, while Performance Monitoring can break performance data down by attributes such as device and app version.
A team can assess app value through a small set of supporting measures for quality and user experience.
How to Choose and Measure App Metrics
Choose metrics by starting with the user outcome, then define an observable event, denominator and time window. A precise definition makes later comparisons clearer.
Step 1: Name the outcome and activation event
Write down the useful result a user gets from the app, then identify an action that shows the user reached it. Activation is the first meaningful value event, such as completing a first project or saving a first item, rather than simply opening the app.
Activation rate is users in a defined signup group who complete that value event within the chosen interval, divided by the group size. Keep the interval fixed when comparing signup cohorts.
Step 2: Define reliability and performance measures
Track user-perceived crashes and application-not-responding events (ANRs), plus startup time and network latency. Android vitals reports crashes and ANRs. Firebase Performance Monitoring can record startup and network traces.
An average can hide slow responses, and an overall rate can conceal failures concentrated in one version or device group. Segment before assigning a cause.
Step 3: Measure engagement and retention
Engagement describes meaningful activity, while retention measures whether a defined group returns. Choose the action that counts as active and the interval that fits the app’s use cycle.
A cohort retention rate is returning users from a signup cohort during a chosen interval divided by users in that cohort at the start. For example, 40 returning users out of 100 gives day-seven retention of 40 percent. This is a worked example, not a benchmark.
returned_users = 40
cohort_users = 100
retention_rate = returned_users / cohort_users * 100
print(f"Day-seven retention: {retention_rate:.0f}%")
python3 retention_rate_demo.py
Day-seven retention: 40%
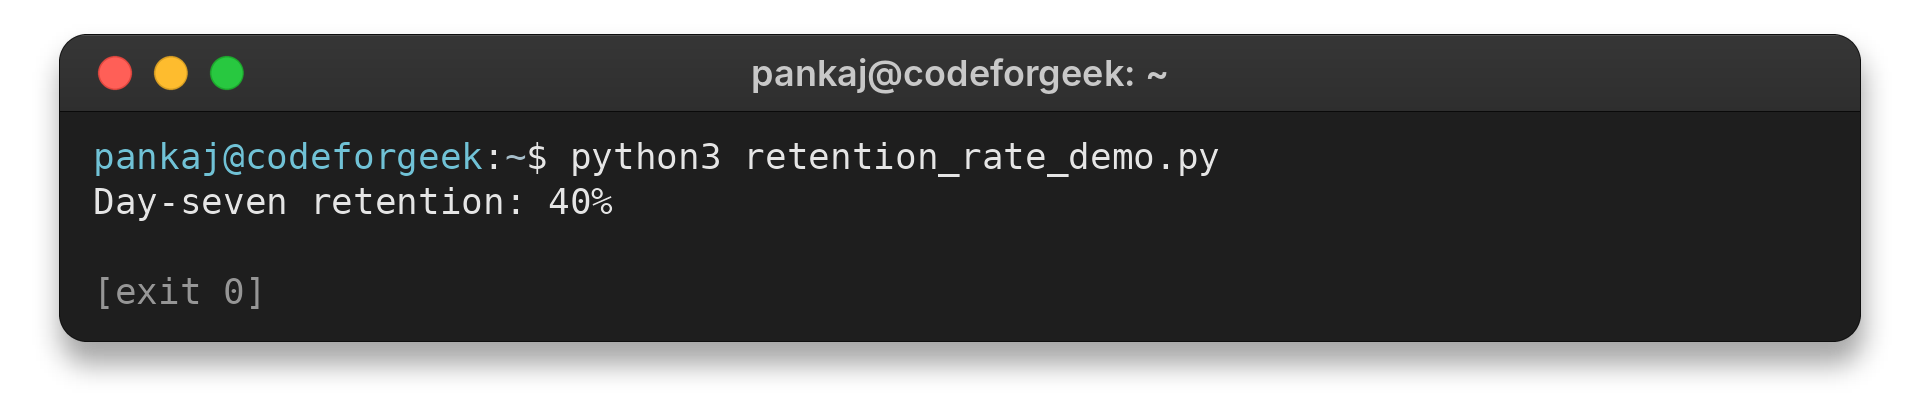
The percentage uses the starting cohort as its denominator. A travel booking app may be valuable even when someone opens it only a few times a year, so select an interval that matches the task rather than assuming daily use.
Step 4: Map conversion and acquisition
A conversion rate is users who complete a defined action divided by users who reached its starting point. In a purchase funnel, compare product viewers, checkout starters and completed orders to see where users stop.
Choose whether the denominator counts people or attempts. A user who retries checkout several times can produce multiple events, so event counts and unique-user conversion answer different questions. State which one the report uses before comparing releases.
Customer acquisition cost (CAC) is acquisition spend divided by the number of new customers attributed to that spend. Calculate it by channel and cohort where possible. Installs alone do not reveal whether an acquisition source brought users who activated or stayed.
Step 5: Compare customer value with cost
Lifetime value (LTV) estimates the value a customer contributes over a stated period or expected relationship. A simple historical estimate is revenue from a cohort divided by its customer count. A forecast requires assumptions about retention and future spend.
Compare LTV and CAC for the same customer definition, channel and time basis. Revenue-based LTV can overstate what remains after service costs, refunds or payment fees, so use contribution margin when that is the business decision.
Step 6: Connect each metric to a decision
For each measure, record its owner, event definition, denominator and time window. When a rate moves, check instrumentation and compare the affected release, device, channel or cohort with a baseline. A correlation points to an investigation, not proof of cause.
App Metric Pitfalls to Check
Metric definitions and segments determine what a change means. Before changing the product, check whether the measurement fits the app’s usage cycle and whether the underlying events are complete.
| Case | Why it misleads | Check |
|---|---|---|
| Daily active users for an occasional-use app | Normal periods without visits can look like churn | Use an interval tied to the user’s task |
| One overall performance average | Slow devices or a faulty version can disappear inside the mean | Compare percentiles and segment by version and device |
| Retention without an active-event definition | Background opens or passive events can count as return | Define an action that indicates value |
| Revenue LTV compared with blended CAC | Different cohorts and cost bases do not make a fair comparison | Align channel, cohort, period and margin basis |
A release can rename an event, fire it twice or stop sending it on one platform. Compare recorded counts with the app flow and split reports by app version and operating system. Mark event-definition changes because periods on either side may not be comparable.
User identity also affects cohort results. A person who changes devices or signs in after using the app anonymously may appear as two users unless the analytics setup reconciles those identities. Document the identity rule and keep it consistent when comparing cohorts.
Google Play notes that filtered Android vitals reports may lack data when too few observations are available. Treat an empty report as missing evidence, not proof that the app has no quality issue.
Conclusion: Tie Each Metric to a Decision
Benchmarks can help frame a question, but differences in audience, market and measurement definitions make direct comparisons unreliable. First compare the same metric across your own releases and cohorts, then use an external benchmark only when its population and calculation match.
To compare app ideas and user outcomes, see steps for creating a successful mobile app. Teams instrumenting a web app can also read how to deploy an Angular app to Firebase Hosting. Firebase Analytics and Performance Monitoring document event collection and performance traces.
FAQ
These answers summarize how to choose and interpret app measurements.
Which app metrics should a small team start with?
Start with one reliability measure, one activation event, one retention measure that fits the use cycle, and the business outcome the app is meant to improve. Add a metric only when it informs a decision.
How do you measure app retention?
Define an active event and interval, group users by a starting cohort, then divide cohort members who return during the interval by the cohort size at the start.
Should app lifetime value always be higher than acquisition cost?
Compare LTV and acquisition cost on the same cohort, channel, time basis and cost definition. A revenue-only estimate may omit service costs, so the comparison does not establish profitability on its own.