One of the most basic algorithms, or we can say statistical methods to predict certain variables is known as Linear Regression. As can be easily figured out from its name, Linear Regression is a very simple application, it is used only for variables that are linearly related to one another. In reality, this kind of data is quite rare, as the real world is quite more complex than what we hope for. But nevertheless, it’s a start. Today in this article we will see how to implement Linear Regression using vanilla JavaScript and the p5 library.
What is Linear Regression?
Suppose you have the following relationship between two sets of data (i.e. two variables x and y):
y=mx+b
where, y -> dependent variable (or the variable we will try to predict for some given x later on), x-> independent variable, m-> slope and b->y-intercept.
It can be seen that this is the humble linear equation in two variables. Now, if we have a significant number of x and y values given we can predict the values of y for a given x relatively easily. For this, the formula given by statisticians is:
m = { summation(x – xmean)(y – ymean) / (x – xmean)^2 }
b = ymean – (m * xmean)
All that we ever required is the values of m and b, next we can easily calculate the y-value using the first equation by putting any x-value. Now let us see how we can implement this in vanilla JavaScript.
Implementing Linear Regression in JavaScript
First, we must create an HTML file, then add the p5 library CDN link in a script tag. Then create a sketch.js file and type in the basic setup function. See the below code:
index.js
<!DOCTYPE html>
<html>
    <head>
        <meta charset="UTF-8" />
        <meta name="viewport" content="width=device-width" />
        <title>Linear Regression with Ordinary Least Squares</title>
        <script src = "sketch.js" ></script>
        <script src="https://cdn.jsdelivr.net/npm/[email protected]/lib/p5.js"></script>
    </head>
    <body>
        <h1>Linear Regression with OLS</h1>
    </body>
</html>
sketch.js
function setup() {
createCanvas(400, 400)
}
For visualization we will be using the p5 library, this is not at all necessary, however, to keep things plain and simple this will be very helpful for us to visualize our data. The way we will collect the x and y through mouse clicks. The user will be able to click on the screen and generate however many data points as they desire. So, first, we create the different coloured backgrounds, and then create two functions mousePressed() and draw() See the below code:
var data = [];
function setup() {
    createCanvas(400, 400);
}
function mousePressed() {
    var x = map(mouseX, 0, width, 0, 1);
    var y = map(mouseY, 0, height, 1, 0);

    var point = createVector(x, y);
    data.push(point)
}
function draw() {
    background(51);
    for (var i = 0; i < data.length; i++) {
        var x = map(data[i].x, 0, 1, 0, width);
        var y = map(data[i].y, 0, 1, height, 0);
        fill(255);
        stroke(255);
        ellipse(x, y , 8, 8)
    }
if (data.length > 1) {
        linearRegression();
        drawLine()
    }
}
We are using the map method in the above code quite generously, you can check out this article if you want a more in-depth explanation. Now you can test out by clicking on the canvas and seeing the points being drawn on the canvas.
Next, we can create two global variables for m and b and then set out to calculate them. Also, create a function called drawLine() which will be used to calculate the m and b and draw the linear-regression line. First, we will simply set the values of m=1 and b=0. Then create the drawLine() function and test out the code:
var m=1;
var b=0;
function drawLine() {
    var x1 = 0;
    var x2 = 1;
    var y1 = m * x1 + b;
    var y2 = m * x2 + b;

    x1 = map(x1, 0, 1, 0, width);
    y1 = map(y1, 0, 1, height, 0);
    x2 = map(x2, 0, 1, 0, width);
    y2 = map(y2, 0, 1, height, 0);

    stroke(255, 0, 255);
    line(x1, y1, x2, y2);
}
Finally, we can create the actual linearRegression() function to calculate the values of m and b:
function linearRegression() {
    var xsum = 0;
    var ysum = 0;
    for (var i = 0; i < data.length; i ++) {
        xsum += data[i].x;
        ysum += data[i].y;
    }
    var xmean = xsum / data.length;
    var ymean = ysum / data.length;

    var num = 0;
    var denom = 0;
    for (var i = 0; i < data.length; i ++) {
        var x = data[i].x
        var y = data[i].y
        num += (x - xmean) * (y - ymean);
        denom += (x - xmean) * (x - xmean);
    }

    m = num / denom
    b = ymean - (m * xmean);
}
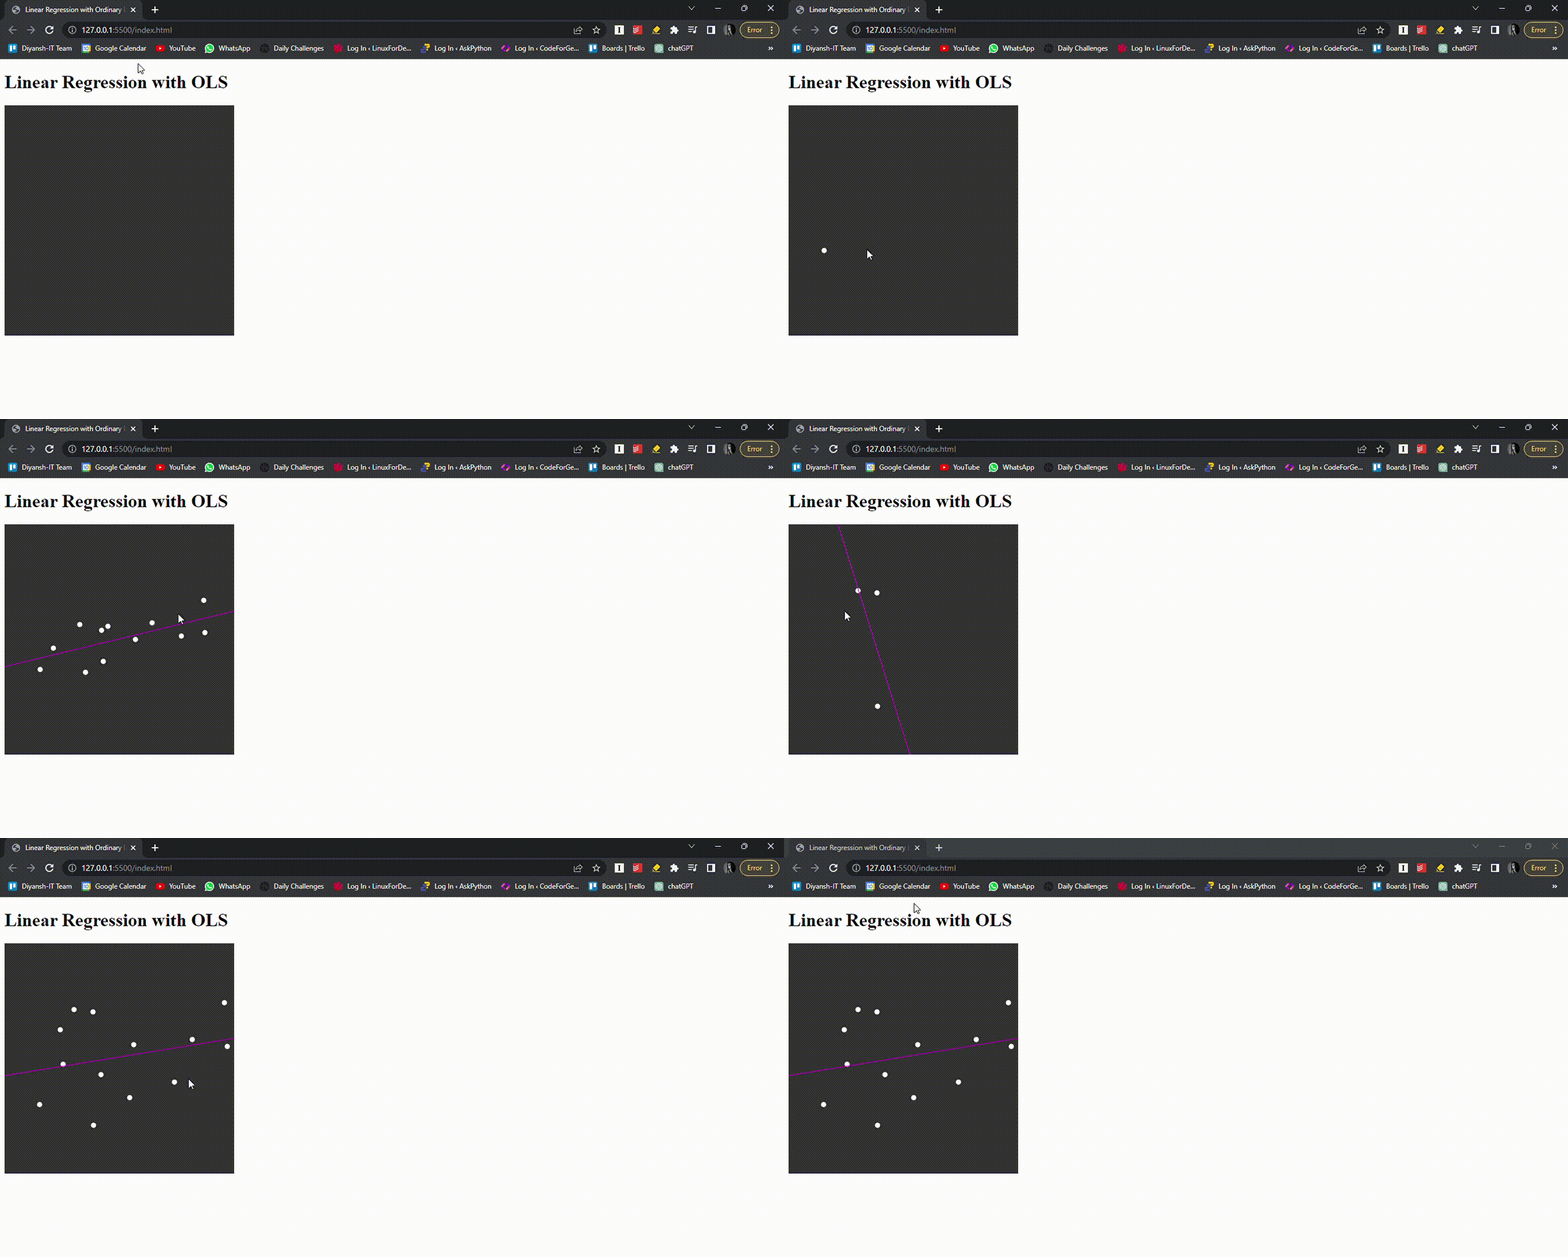
Finally, we are done, see the below GIF.
Output:

Complete Code:
sketch.js
var data = [];

var m = 1;
var b = 0;

function setup() {
    createCanvas(400, 400);
}

function linearRegression() {
    var xsum = 0;
    var ysum = 0;
    for (var i = 0; i < data.length; i ++) {
        xsum += data[i].x;
        ysum += data[i].y;
    }
    var xmean = xsum / data.length;
    var ymean = ysum / data.length;

    var num = 0;
    var denom = 0;
    for (var i = 0; i < data.length; i ++) {
        var x = data[i].x
        var y = data[i].y
        num += (x - xmean) * (y - ymean);
        denom += (x - xmean) * (x - xmean);
    }

    m = num / denom
    b = ymean - (m * xmean);
}

function drawLine() {
    var x1 = 0;
    var x2 = 1;
    var y1 = m * x1 + b;
    var y2 = m * x2 + b;

    x1 = map(x1, 0, 1, 0, width);
    y1 = map(y1, 0, 1, height, 0);
    x2 = map(x2, 0, 1, 0, width);
    y2 = map(y2, 0, 1, height, 0);

    stroke(255, 0, 255);
    line(x1, y1, x2, y2);
}

function mousePressed() {
    var x = map(mouseX, 0, width, 0, 1);
    var y = map(mouseY, 0, height, 1, 0);

    var point = createVector(x, y);
    data.push(point)
}

function draw() {
    background(51);
    for (var i = 0; i < data.length; i++) {
        var x = map(data[i].x, 0, 1, 0, width);
        var y = map(data[i].y, 0, 1, height, 0);
        fill(255);
        stroke(255);
        ellipse(x, y , 8, 8)
    }
    if (data.length > 1) {
        linearRegression();
        drawLine()
    }
}
Conclusion
This is the code implementation of Linear Regression in vanilla JavaScript. However most of the time in the real world we will only get polynomial data, and variables are not always linearly related i.e. Linear Regression is a very simple application that is very far away from the real world. That is why it is recommended to learn other technologies in ML/AI such as Neural Networks, Polynomial Regression, K Nearest Neighbour etc. One important tool to master if you’re looking to dive into Machine Learning is Tensorflow. For more such amazing articles be sure to follow CodeForGeek!
Reference
https://stackoverflow.com/questions/6195335/linear-regression-in-javascript

