New to Rust? Grab our free Rust for Beginners eBook Get it free →
pandas.crosstab() Function in Python: Computing Cross-Tabulation

In Pandas, the pandas.crosstab() function is used to compute a cross-tabulation of two (or more) factors. It is a convenient way to analyze the relationship between two or more categorical variables in a DataFrame.
In this article, we will first understand the syntax and the parameters of pandas.crosstab() function, then we will look at some examples to demonstrate it. In each example, we will pass different parameter combinations to understand how this function works in different scenarios. Let’s get started.
Syntax of pandas.crosstab() Function
By specifying the index and columns, this function creates a table that shows the frequency distribution of observations across various categories. Additional parameters such as values, aggfunc, margins, and normalize provide flexibility in tailoring the output.
Syntax:
pandas.crosstab(index, columns, values=None, rownames=None, colnames=None, aggfunc=None, margins=False, margins_name='All', dropna=True, normalize=False)
Parameters:
- index: The DataFrame column to use as the row index in the cross-tabulation.
- columns: The DataFrame column to use as the column index in the cross-tabulation.
- values (optional): An array-like object representing the values to aggregate.
- rownames (optional): If provided, these will be the names for the rows.
- colnames (optional): If provided, these will be the names for the columns.
- aggfunc (optional): Aggregation function to apply (e.g., ‘sum’, ‘mean’, ‘count’). If not specified, the default is ‘count’.
- margins (optional): If True, add row/column margins (subtotals).
- margins_name (optional): Name of the row/column that will contain the totals when margins are True.
- dropna (optional): If True, do not include columns whose entries are all NaN.
- normalize (optional): If True, compute proportions (percentages) rather than counts.
Implementation of pandas.crosstab() Function
For implementing pandas.crosstab() function let’s first create a DataFrame.
import pandas as pd
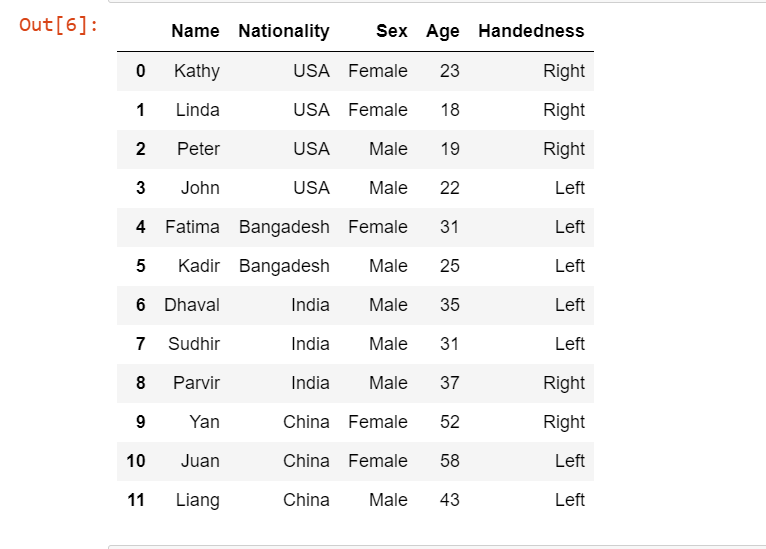
df = pd.read_excel("survey.xls")
df
Here we first imported the Pandas as pd, then created the DatFrame using an XLS file, the XLS file name is survey.xls, and then printed the DataFrame.
Output:
Let’s now implement pandas.crosstab() function by passing different parameters into it for the above Pandas DataFrame.
Example 1: Passing ‘index’ and ‘column’ Parameters
pd.crosstab(df.Nationality,df.Handedness)
Here we have taken the row index as df.Nationality and column index as df .Handedness means in the row level on the x-axis for the table, we will have Nationality and in the column on the y-axis, we will have Handedness.
Output:
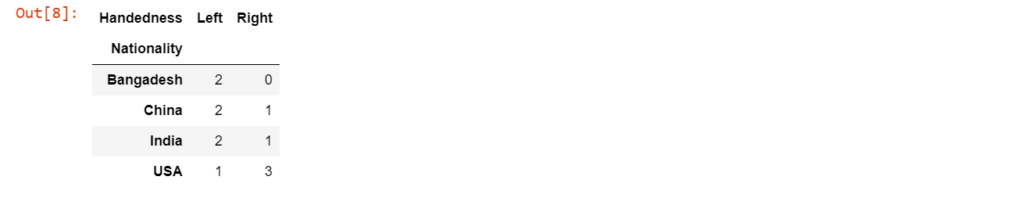
We can see that we have got a table in which we have two individuals from Bangladesh who are left-handed. Similarly, the USA has a value of 3 which shows the frequency of right-handed people is three for the USA.
Example 2: Passing ‘index,’ ‘column,’ and ‘margins’ Parameters
As we know when the margins parameter is True in the pandas.crosstab() function then it will give us a total of rows and columns margins.
pd.crosstab(df.Sex,df.Handedness,margins=True)
In the above code, we have taken the Sex variable in the row level and Handedness in the column level which will give us the frequency of how many males and females are left-handed and right-handed. With this, we also passed the argument margins as True which will generate the Total individuals of left-handed and right-handed in Male and Female.
Output:
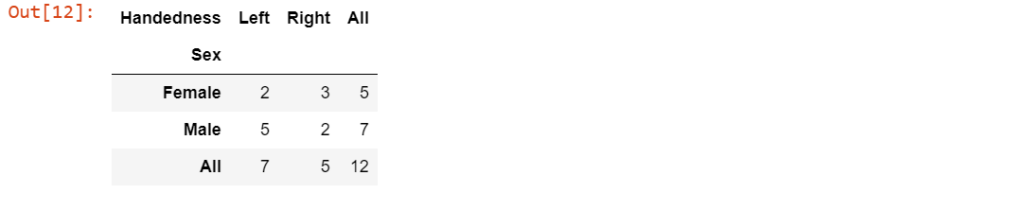
In the output, we can see that we got the total of females as 5 and males as 7. With this, we got a total of left-handed persons and right-handed persons.
Example 3: Using an Array for the ‘column’ Parameter
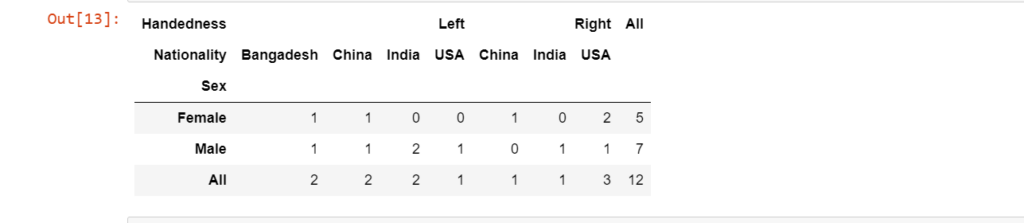
Here to add one more variable which is Nationality into the column level that is on the y-axis of the table we will pass an array in which we will put df.Handedness and df.Nationality.
pd.crosstab(df.Sex,[df.Handedness,df.Nationality],margins=True)
Output:
Example 4: Passing ‘row,’ ‘column,’ and ‘normalize’ Parameters
Sometimes it’s good to have a percentage so to do this we will use another argument called normalize which normalizes by dividing all values by the sum of all values.
pd.crosstab(df.Sex,df.Handedness,normalize ='index')
We have passed the parameter normalize as an index which calculated the percentage at a row level.
Output:
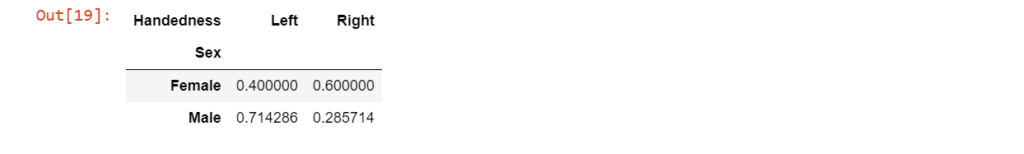
We got that 40% of people are left-handed Females and 60% are right-handed Females while approximately 72% of males are left-handed and 28% of males are right-handed.
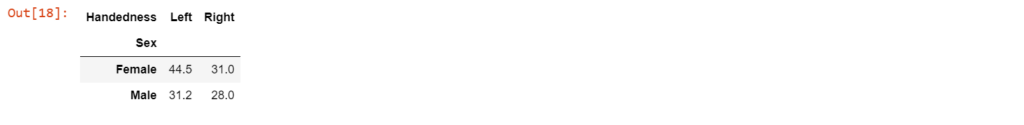
Example 5: Passing ‘index,’ ‘column,’ ‘values,’ and ‘aggfunc’ Parameters
Here we will find the average age of males and females for right-handed and left-handed from the survey.xls DataFrame by passing aggfunc=np.average into the pandas.crosstab() function.
import numpy as np
pd.crosstab(df.Sex,df.Handedness,values=df.Age, aggfunc=np.average)
Output:
Summary
Now that we have reached the end of this article, we hope it has elaborated on how to use the pandas.crosstab() function from the Pandas library. Here’s another article that details how to get column names in Pandas DataFrame. CodeForGeek has many other entertaining and equally informative articles that can be of great help to those who want to advance in Python, so be sure to check them out as well.
Reference
https://pandas.pydata.org/docs/reference/api/pandas.crosstab.html#