New to Rust? Grab our free Rust for Beginners eBook Get it free →
Node.js Debugging: Tools, Techniques, and Challenges

Node.js, a widely acclaimed runtime for JavaScript, empowers developers with the ability to construct highly scalable applications. Debugging, an integral part of the development process, plays a vital role in identifying and resolving issues that may arise in Node.js applications. This all-inclusive article drives into a variety of effective debugging techniques specifically tailored for Node.js, equipping developers with the skills necessary to diagnose and resolve software glitches efficiently.
Node.js Debugging Techniques
By meticulously following these steps, developers can skillfully diagnose and troubleshoot issues in their Node.js applications, thereby enhancing software quality and streamlining development workflows. Let’s see them one by one.
1. Console Logging
Console logging emerges as one of the simplest yet highly effective debugging techniques. By sensibly in adding console.log statements within the code, developers can acquire pertinent information in the console, aiding in the comprehension of variable values and program flow.
console.log('Value of the variable:', variable);
2. Debugger Keyword
The debugger statement serves as a valuable tool for debugging code. By incorporating the debugger keyword into your code, you can establish breakpoints and halt the program’s execution. This allows you to inspect variable values and step through the code one line at a time, facilitating the identification and understanding of any issues or unexpected behaviour.
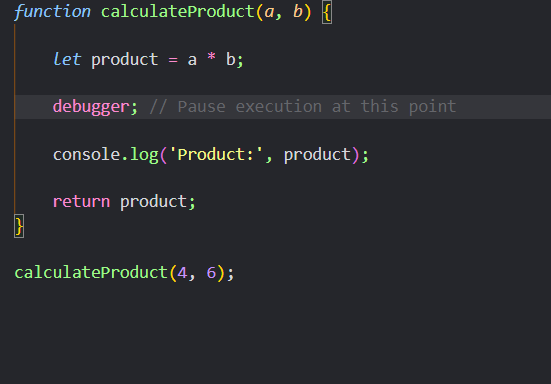
In the subsequent code snippet, we have a function called calculateProduct that computes the product of two numbers. By inserting the debugger statement at a specific juncture in the code, we can pause the program’s execution at that precise moment.
3. Integration with Chrome DevTools
The integration between Node.js and Chrome DevTools offers developers a seamless and efficient debugging experience. By launching Node.js with the inspect flag and accessing Chrome DevTools, developers unlock a powerful interface that simplifies the process of establishing breakpoints, analyzing variables, and debugging Node.js code. This integration deals with basic debugging capabilities and furnishes additional features that enhance the debugging workflow.
4. Using VS Code Debugger Tool
In addition to the inherent debugging capabilities of Node.js, several powerful tools simplify the debugging process. One such tool is the Visual Studio Code (VS Code) Integrated Development Environment (IDE), which offers extensive debugging features explicitly designed for Node.js development.
To utilize the debugging features in VS Code, follow these steps:
- Install the “Node.js Debug” extension in VS Code.
- Place breakpoints in your code by clicking on the desired line number.
- Launch the debugger by clicking the “Run” button or pressing F5.
- Start your Node.js application in debug mode.
- The debugger will pause at the breakpoints, allowing you to inspect variables and step through the code.
- By leveraging these debugging tools, you can greatly enhance your debugging capabilities and streamline the troubleshooting process.
5. Analyzing Stack Traces
When encountering errors or exceptions in your Node.js applications, analyzing stack traces can offer valuable insights into the root cause of the issue. Stack traces showcase the sequence of function calls leading up to the error, enabling you to pinpoint the exact location and path that led to the problem.
For instance, consider the following stack trace:
Error: Cannot read property 'name' of undefined
    at greet (/path/to/file.js:5:15)
    at sayHello (/path/to/file.js:9:5)
    at /path/to/file.js:13:1
In this example, the stack trace indicates that an error occurred at line 5 in the greet function, which was called by the sayHello function at line 9. By examining the stack trace, you can notice the source of the error and focus your debugging efforts accordingly.
Node.js Debugging Challenges
There are some common situations that you often encounter while debugging Node.js applications that can hinder your debugging process. Let’s see them.
1. Overcoming Debugging Challenges in Asynchronous Code
Debugging asynchronous code in Node.js poses unique challenges due to its non-blocking nature. However, employing techniques such as async/await, promises, and meticulous error handling allows for effective debugging of asynchronous code, enabling the identification of issues such as race conditions and callback errors.
2. Mitigating Memory Leaks and Performance Issues
Memory leaks and performance breakage can significantly impact the stability and efficiency of Node.js applications. By utilizing debugging tools like heap snapshots and performance profilers, developers can identify memory leaks and stoppages within the codebase. This empowers them to optimize memory usage and enhance overall performance.
Conclusion
Mastery of effective debugging techniques is crucial in ensuring the seamless functioning of Node.js applications. In this article, we have explored several valuable techniques to enhance your Node.js debugging skills, including the strategic use of console.log statements, leveraging the Node.js debugger, harnessing debugging tools like Visual Studio Code, and analyzing stack traces.
By applying these techniques and practising regularly, you can become a better Node.js developer capable of efficiently identifying and resolving issues in your code.
References