New to Rust? Grab our free Rust for Beginners eBook Get it free →
Monitoring Node Applications using Datadog

Monitoring your application in the production server is as crucial as the development phase. With the proper monitoring, one can trace the errors and prevent downtime of the system way before its emergence. In this tutorial, we are going to learn about the cloud monitoring software Datadog and how we can use it to monitor Node.js applications.
About Datadog
Datadog is a cloud monitoring software. You can ingest your application metrics in the Datadog system through various integrations and Datadog builds easy-to-view graphs that one can view to understand the metrics of your application in real-time.
To begin with, navigate to the Datadog website and create a free trial account. You can also win cool merchandise.
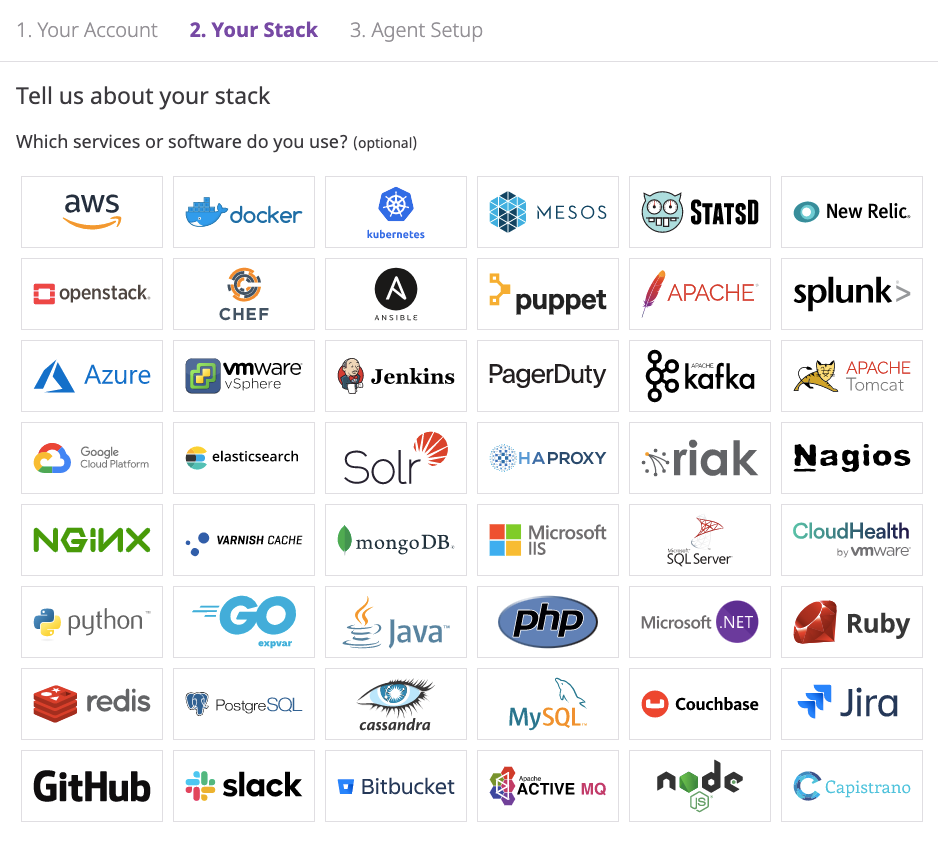
Once you have created the account, you can simply follow the steps to install the Datadog agent in your system.
Choose the stack for which you want to perform the monitoring, in our case you can select Node.js.
The next step would be to install a Datadog agent in your system.
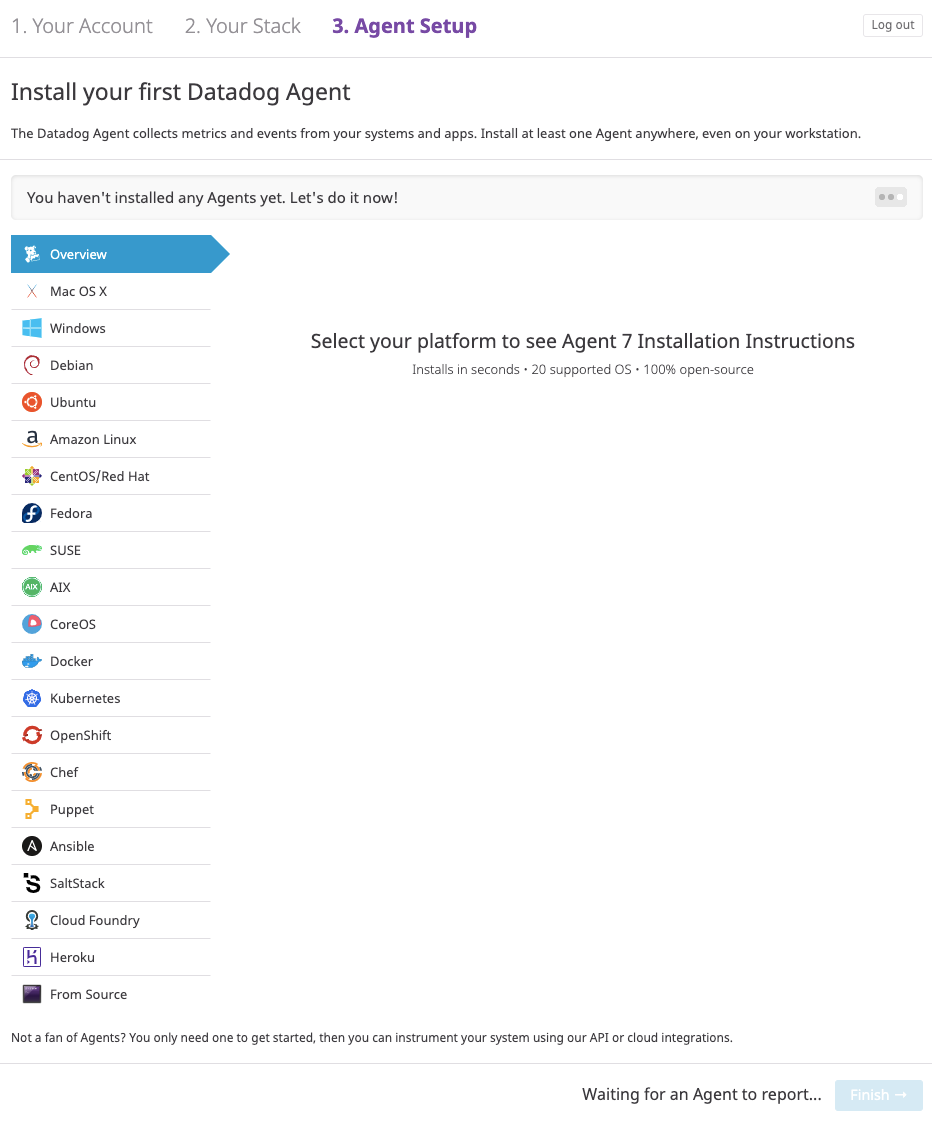
If you are just trying out Datadog like me, you can select Mac or Windows depending upon your operating system.
Once you have installed Datadog, you are good to go. The Datadog Agent is the software that sends the metrics to Datadog from your system.
Let’s go ahead and integrate Datadog in our Node.js application.
Adding Datadog metrics module in Node.js application
To begin with, create a new folder and initiate a Node.js project.
npm init --y
Now, let’s install the dependencies.
npm install --save express connect-datadog
Once the dependencies are installed, we can add the Datadog module. If you are using an Express.js application, make sure that the Datadog middleware is added in the end. Check out the code below for reference.
const express = require("express");

const router = express.Router();

const app = express();
var dd_options = {
'response_code': true,
'tags': ['app:my_app']
};
var connect_datadog = require('connect-datadog')(dd_options);
router.get("/", (req, res) => {
console.log("Request");
res.send("Ok");
});
app.use(connect_datadog);
app.use(router);
app.listen(3000);
console.log("Started at port 3000");
Now, run the application using the following command.
node app.js
Hit some requests to the server and make sure your Datadog agent is running.
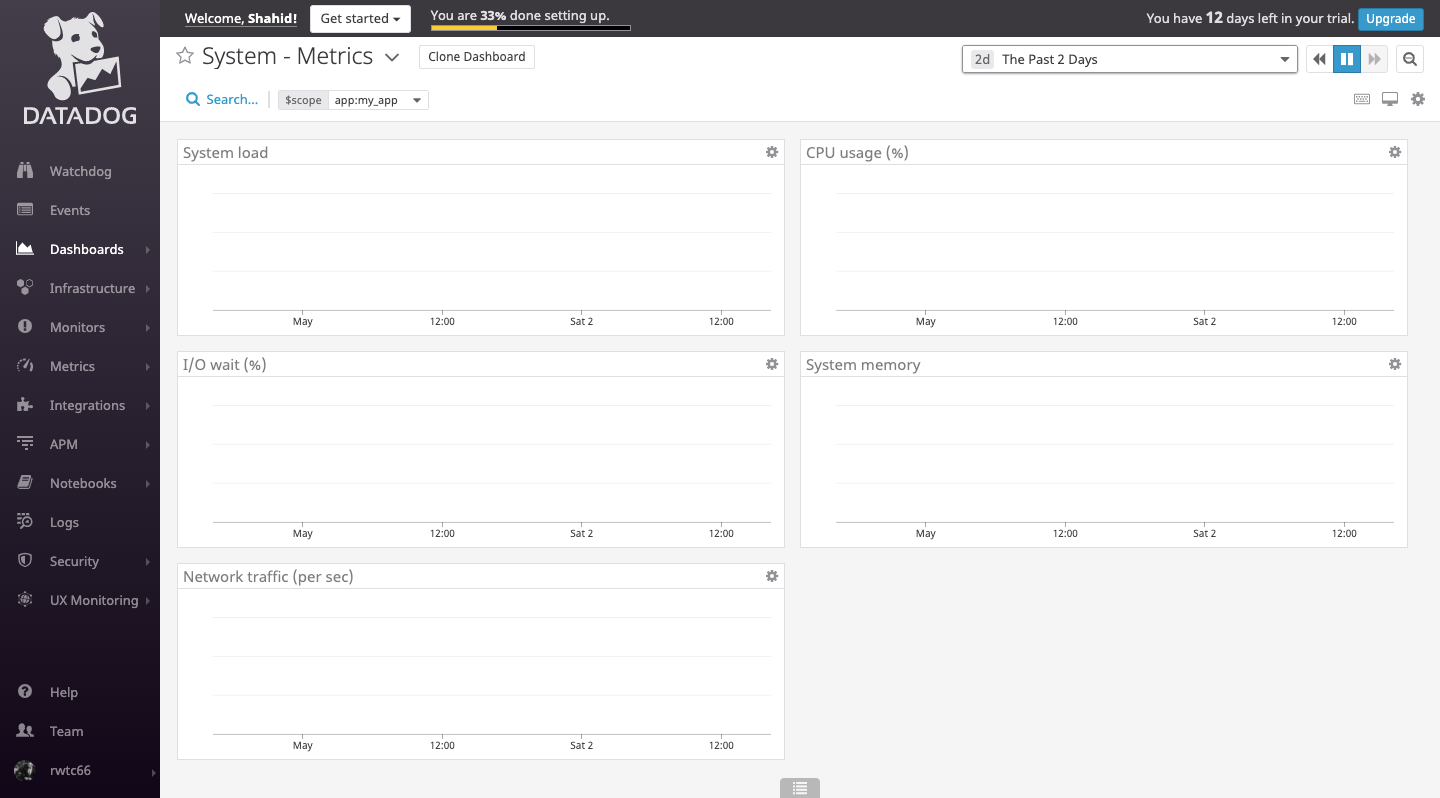
Visit the Datadog dashboard and choose system metrics, in this filter out the scope using the name of the application. In our case, it’s my_app.
Since I have run the simple application in my local machine with few requests only, the result is not showing on the graph. We should have enough requests to actually show it on the graph.
Integration is simple and sweet. You can integrate tons of applications running on different servers and view all the data in one place.
Final Words
Datadog provides a one place application and system monitoring which is priceless in my opinion. There are various other use cases than what I have described as well. We generally run various instances of the application and software in our server and forget to monitor it assuming everything will go right in an ideal case. There is nothing wrong with being optimistic but the only way we can be sure about the health of our systems is through monitoring and Datadog does that really well.