New to Rust? Grab our free Rust for Beginners eBook Get it free →
Big Data Analytics Software: 7 Tools Compared

As a data workload grows, it can be hard to tell which analytics tools do different jobs. Big data analytics software helps teams prepare data and use it to answer questions or operate services.
This article compares seven tools by their roles and gives you a step-by-step way to choose what your workload needs.
TL;DR: Big Data Analytics Software
Big data analytics software covers tools for moving, storing and processing data, monitoring services, and exploring results. A small, well-matched stack takes less coordination than adopting every name on a list. In this piece, I’ll map seven products to their roles and give you a way to shortlist them.
- Tableau: business intelligence and visual exploration.
- Splunk Observability: logs, metrics and traces for running systems.
- Apache Cassandra: distributed storage for workloads designed around its query model.
- Qlik Talend Cloud: data integration, transformation and quality.
- Apache Spark: large-scale batch and streaming processing.
- Cloudera Platform: governed data workloads across hybrid environments.
- Plotly.py: interactive charts in Python applications and notebooks.
These products serve different parts of a data workflow. Start from the business decision and data flow, then shortlist the capabilities your team needs.
What Is Big Data Analytics Software?
Big data analytics software helps collect, prepare, store, process, inspect or visualize data so a team can answer questions or operate a service. “Big data” can mean high volume, varied formats or fast arrivals. Agree on the question and its owner first, because teams can calculate the same metric from different source rules.
Think of the stack as stages where tools connect sources, clean records, hold data, run queries, compute transformations or present results. Operations teams also need ways to detect pipeline and application failures. Document each handoff with an owner, format and freshness target.
| Stage | Question it answers |
|---|---|
| Integration | How do records move and get prepared? |
| Storage | How should applications write and retrieve records? |
| Processing | How should larger transformations run? |
| Platform and governance | Where will workloads run, and how are access and policies managed? |
| Business analysis | How will analysts explore and share findings? |
| Operations | How can a team see service health and investigate incidents? |
Collection, storage and scrubbing
Collection captures records from source systems and delivers them on a schedule or continuously. Storage choices depend on the queries, retention period and access rules the team needs to support.
For example, a retail report may load sales each hour while application telemetry arrives continuously. That difference changes the freshness target and how teams handle late or missing records.
Scrubbing can validate required fields, normalize timestamps, deduplicate stable identifiers and route invalid rows to a quarantine table. Keep the incoming copy available for replay, and track how many records pass or fail each check. Databricks documents schema validation and pipeline expectations that can warn, drop records or fail an update when a rule is violated.
The 7 Big Data Analytics Software Options Compared
The table narrows the list by role. The reviews explain each product’s job and where another layer is needed. Official pages communicate vendor positioning, while performance claims require independent tests.
| Software | Main job | Good fit when | Plan for |
|---|---|---|---|
| Tableau | Business intelligence | People need interactive visual analysis | A prepared source and licensing review |
| Splunk Observability | Operations telemetry | Teams diagnose services with logs, metrics and traces | Ingestion, retention and alert design |
| Apache Cassandra | Distributed database | An application needs a resilient, partitioned data store | Query-first data modeling and operations |
| Qlik Talend Cloud | Data integration | Sources need to be connected, transformed and governed | Connector and pipeline fit checks |
| Apache Spark | Distributed processing | Transformations outgrow simpler processing | Cluster management and pipeline skills |
| Cloudera Platform | Hybrid data platform | Workloads span data-center and cloud environments | Deployment scope and platform administration |
| Plotly.py | Interactive charting | Developers build charts in Python workflows | A separate source, compute layer and app surface |
Teams seeking a unified analytics environment can also compare Databricks Lakehouse. Databricks describes a common architecture for data management, analytics and AI across batch and streaming work. Its pipeline expectations can warn, drop invalid records or fail updates, so compare governance and operating effort with your existing services.
1. Tableau
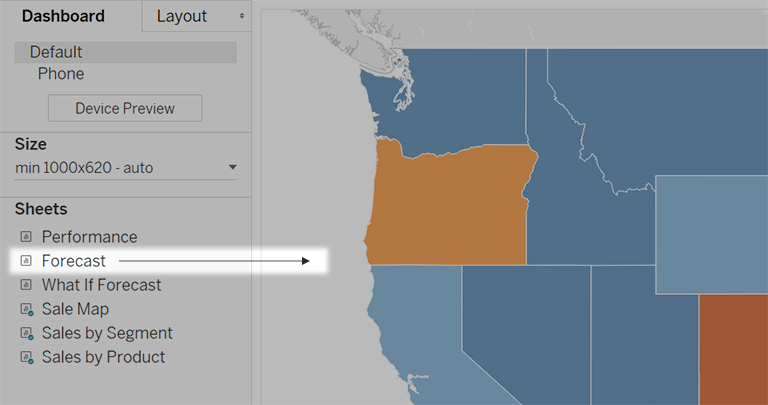
Analysts can use Tableau to explore prepared data with interactive charts and dashboards, and its documentation shows how to combine sheets and add interactivity. Check which deployment matches your data policies and team’s workflow.
Test a representative dashboard against your source, refresh cadence and access model. Check viewer access, workbook ownership and current licensing for your deployment.
2. Splunk Observability
Splunk’s product page describes linking telemetry and business context to detect issues. Metrics show changes over time, traces follow a request across services, and logs preserve event details. Together these signals help teams trace service incidents to affected dependencies.
Check what services emit, how signals are collected and which alerts need action. Estimate ingestion and retention costs from expected volume. Pair operational monitoring with a separate analytics layer when business records need exploration.
3. Apache Cassandra
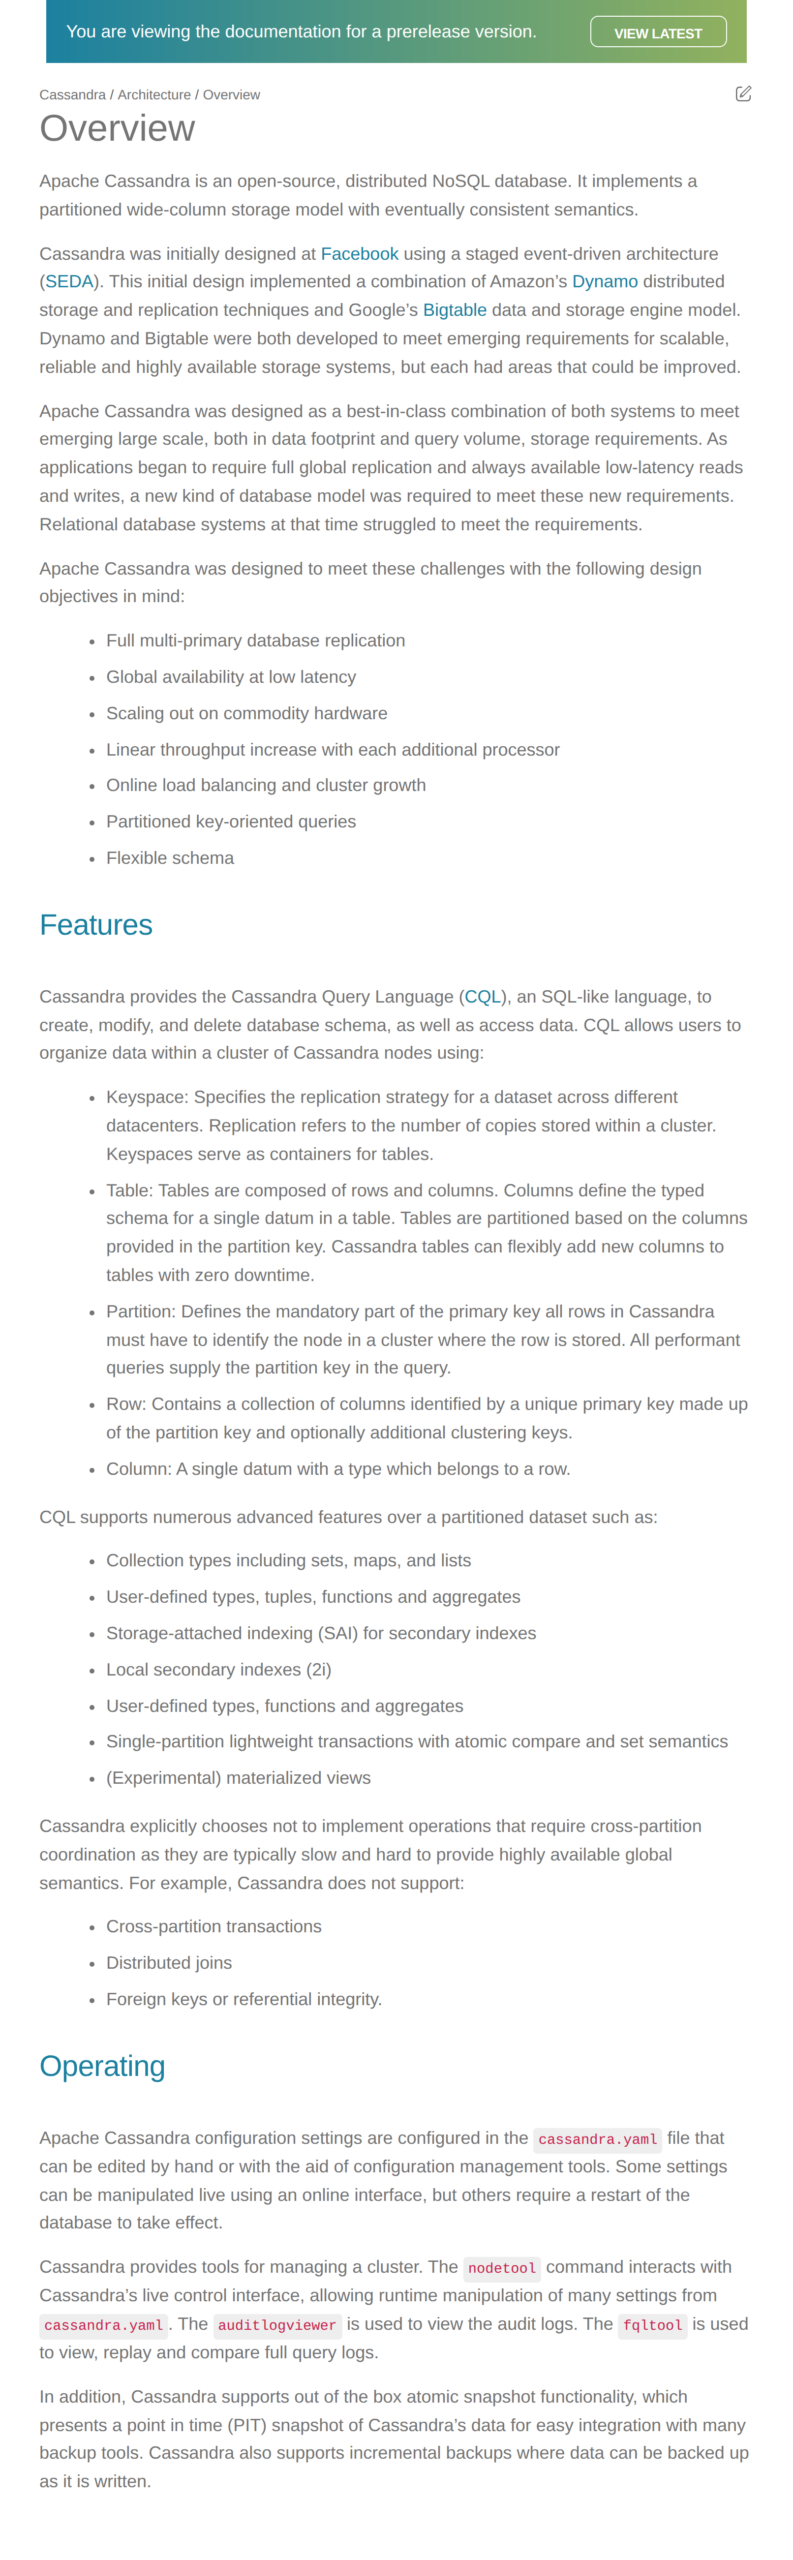
Apache Cassandra uses a distributed NoSQL model for applications that need data across nodes. Choose partition keys from the application’s expected reads and writes so tables serve the queries it makes. A warehouse is a better fit for broad, ad hoc business analysis.
Plan for query-driven partitioning and day-to-day database operations. Review release guidance before using relational-style joins, foreign keys or transactions across partitions, because Cassandra uses a different model. The screenshot below shows a prerelease documentation notice.
4. Qlik Talend Cloud
Qlik Talend Cloud connects, transforms and checks data before analysis. Its product page positions it as a trusted-data delivery platform. Compare the current offer with older Talend editions before selecting an edition.
Test connector and change-capture support, then simulate a source schema change and invalid record. Record job failure alerts, retry behavior, data-quality rules and the operational owner.
5. Apache Spark
Apache Spark runs data engineering, data science and machine-learning workloads on a machine or cluster, supporting batch and streaming processing. Before a trial, agree which team owns the cluster, how failures reach that team and which data format the job will consume.
Pilot a representative job and measure runtime, resource use and recovery under expected growth. Use that estimate to plan cluster capacity. For modest workloads, an existing database or scheduled job may avoid unnecessary complexity.
6. Cloudera Platform
Cloudera Platform brings data management, analytics and governance to environments such as data centers and public clouds. Evaluate it when deployment consistency, control and common administration matter. Check administration and deployment responsibility against the skills your team can sustain.
Map which workloads stay on premises, which run in cloud, and how identity, policies and lineage span both. A broad platform needs administration skills, so scope a representative pilot before estimating migration effort.
7. Plotly.py
Plotly.py is a Python graphing library for interactive visualizations in notebooks, reports and web applications. Its documentation lists line, bar, scatter, heatmap and other chart types. Check how the target environment loads, packages and serves the chart.
Plan who maintains the app and its access controls. Check chart rendering in the target notebook or application. For managed dashboards used by nontechnical teams, compare a BI product.
How to Choose Big Data Analytics Software Step by Step
Use a small selection exercise before comparing demos, because a polished preview can hide recovery behavior and recurring costs.
1. Name the decision or operational question
Write down the action the data should support: a weekly inventory decision, an anomaly investigation, a customer report or a model input. Record who needs the answer, how fresh it must be and what happens if it is late. This helps distinguish business intelligence from operational observability or a backend application’s data store.
2. Map the data before choosing the product
List each source, format, approximate size, arrival schedule, owner and sensitivity, then mark which records are structured, nested, streamed or updated in place. Note the destination and low-latency queries. This map can reveal connector needs, data-quality work and governance requirements before feature comparisons.
3. Choose the missing capability
Assess integration tools for source transfers, Cassandra for distributed writes and Spark for cluster transformations. Consider Tableau for dashboards, Plotly.py for Python charts, Splunk Observability for service telemetry and Cloudera for hybrid governance.
4. Check fit, ownership and total operating effort
For each candidate, verify connectors, deployment, access controls, backup, recovery, support and required skills. Ask whether costs depend on users, ingestion, retention, compute or connectors. Estimate infrastructure and staffing alongside any licence, using expected production usage rather than a small pilot.
5. Run a bounded pilot with acceptance checks
Use sample data and an end-to-end question, then record output, freshness, runtime, recovery, access and observed cost for each candidate, including a late file, malformed record or schema change. Ask data owners and operators to review the evidence before selection.
Common Selection Mistakes and Edge Cases
Check these edge cases because a clean demo can miss late records, schema changes and access rules.
| Situation | Why the choice can fail | Check before adoption |
|---|---|---|
| The workload uses relational data | A distributed engine adds cluster setup, monitoring and staffing overhead. | Benchmark the existing database or scheduled workflow first. |
| Dashboards disagree with source totals | Visualization cannot repair duplicate, late or inconsistently defined records. | Trace a sample to its source and agree on business definitions. |
| A pipeline breaks after a schema change | A connector that works today may not handle drift or source API changes safely. | Test schema evolution, alerting, retries and ownership. |
| Teams want broad ad hoc queries on Cassandra | Its partitioned data model serves defined query shapes better than broad relational joins. | List the queries first. Compare a warehouse or relational store if broad analysis dominates. |
| A system handles personal or regulated data | Convenient cloud defaults may not meet residency, retention or access requirements. | Review the exact deployment, identity, audit and retention controls with the data owner. |
| The pilot succeeds but operating costs rise | More events, longer retention or additional cluster capacity can change the bill. | Estimate recurring usage and staff time at expected production volume. |
For example, a weekly report from a transactional database may need one scheduled export and a dashboard. Test freshness, source load and access controls before introducing another processing layer.
For petabyte-scale logs, include Apache Pinot when comparing Apache Druid and ClickHouse. Pinot describes itself as a distributed OLAP datastore for low-latency, high-throughput analytics. Druid’s design docs emphasize continuous ingestion and fast queries, while ClickHouse’s architecture overview discusses high-ingest analytics over petabyte-scale data.
Replay representative traffic and compare time filters, aggregations, retention, query concurrency, storage and operator effort. A small demo query will not establish production cost or performance.
Conclusion
Keep a short decision record with the business question, data owner, acceptance checks and expected running cost. For background on event streaming, read CodeForGeek’s Apache Kafka guide. Our SQL interview questions can help teams review the query basics behind analytics work.
FAQ
These quick answers clarify how the tools fit together and what to evaluate first.
What software is used in big data analytics?
Teams combine tools according to the job: integration, storage, processing, visualization and operations. This list covers Qlik Talend Cloud, Cassandra, Spark, Tableau, Plotly.py, Splunk Observability and Cloudera Platform. Each product focuses on a defined set of capabilities.
What is big data analytics software?
Big data analytics software helps businesses collect, prepare, store, process, inspect or visualize large, varied or fast-moving datasets. The phrase covers several complementary layers that support questions and operating needs.
How do I choose big data analytics software for a business?
Start with the decision the data should support, map its sources and freshness needs, identify the missing stack role, check integration and governance requirements, then run a small pilot with defined output, reliability and cost checks.
Can one tool handle all big data analytics?
Some platforms combine several capabilities, but storage, processing, integration, business dashboards and service observability remain different jobs. Check which capabilities are included in the exact product and deployment, and avoid paying for layers your workload does not need.