New to Rust? Grab our free Rust for Beginners eBook Get it free →
Creating Tables With Python Tabulate (Multiple Examples)

Creating tables is an essential task when it comes to organizing and visualizing data in Python. In order to create tables, Python provides a package called Tabulate. In this article, we’ll explore the various ways in which we can use the tabulate() function provided in Tabulate for creating tables in Python along with some supporting examples to better understand its implementation.
Also Read: How to Use Emoji Module in Python (With Examples)
What Is Tabulate and How to Use It?
Tabulate is an open-source package provided by Python for creating tables from given data which is in the form of lists or dictionaries. This can come in handy in many fields like data science where it is important to visualize data for better understanding. To create tables, we will mainly use the tabulate() function from Tabulate.
Before we can start creating tables, we must first install Tabulate. This can be done using the below command.
Installation Syntax:
pip install tabulate
Now we can import the tabulate function using an import statement.
Import Syntax:
from tabulate import tabulate
Now let’s understand how we can create tables with some examples.
Examples of Creating Tables in Python Using Tabulate
In this section, we’ll look at different types of examples of creating tables along with their outputs.
1. Creating a Table from List Entries
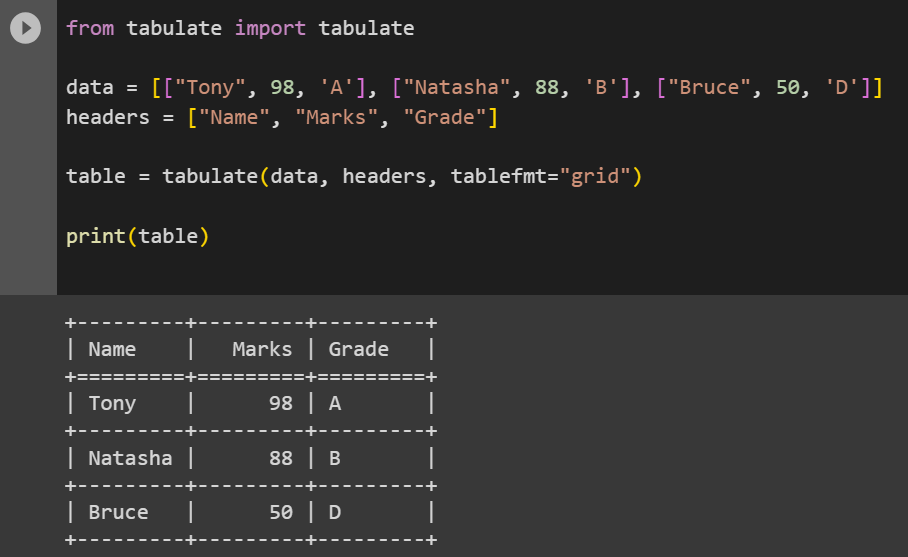
Let’s look at a basic example of converting a list containing lists of entries into a table using tabulate.
Example:
from tabulate import tabulate

data = [["Tony", 98, 'A'], ["Natasha", 88, 'B'], ["Bruce", 50, 'D']]
headers = ["Name", "Marks", "Grade"]

table = tabulate(data, headers, tablefmt="grid")

print(table)
Here we first import the tabulate() function in order to be able to use it. We then declare the data to be tabulated as a list named data. This list data contains 3 entries which will act as rows in the final table created. Each row contains a name, mark and grade. We can specify the header name for each of these three columns, using a list headers.
We then use tabulate(), which will take the two lists, data and headers as parameters to return a table. We also pass in an optional argument tablefmt=”grid” which specifies what format we want the table to be in. Here we have specified a grid format for our table. Some other table formats we can access using tablefmt are simple, plain and many more. This changes the way in which the table appears when printed.
The table returned by tabulate() is stored in a variable table which can be printed to display our data in its table form.
Output:

2. Creating a Table from Dictionary Entries
Above we have seen how to create a table from entries that are in the form of a list. Now, we’ll see how to create a table from a list of entries in the form of a dictionary.
Example:
from tabulate import tabulate

data = [{"Name": "Alice", "Marks": 98, "Grade": "A"}, {"Name": "Bruce", "Marks": 50, "Grade": "D"}]
headers = data[0].keys()

rows = []
for x in data:
  rows.append(x.values())

table = tabulate(rows, headers, tablefmt="simple")

print(table)
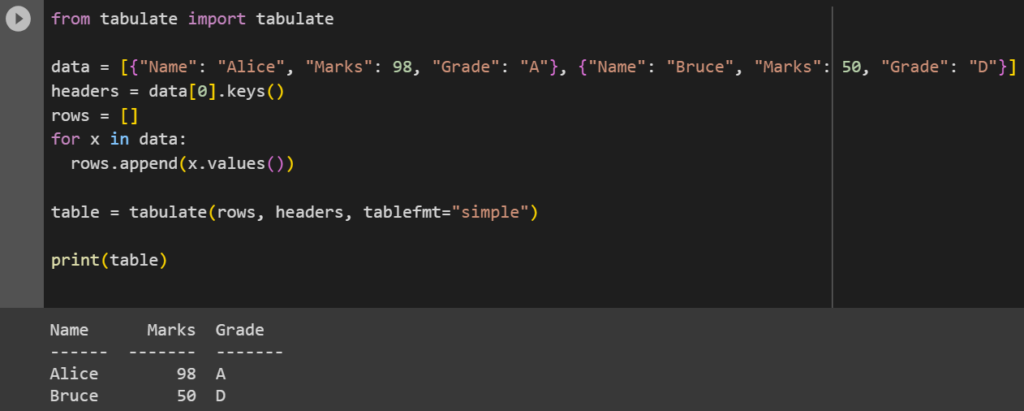
Obtaining a table from dictionary entries is not as straightforward as creating a table from list entries.
Here, we first import the tabulate() function. Then we store all of our dictionary entries in a list called data. To give header names to our table, we simply access the keys from the first dictionary entry (the entry at index 0 of the list, data[0]) using the keys() method. The keys (Name, Marks and Grade) are now stored as a list in headers and act as the header of the columns in our final table.
Now to access the values in each entry we must iterate through the list and get the values from each dictionary. For this, we will declare an empty list rows and with each iteration, we will access the values from the dictionary using the values() method and append them to the list rows using the append().
We now have our values and headers and can convert our data into a table using tabulate(). We have set the tablefmt as simple meaning we’ll get a table with minimal formatting compared to using a grid.
Output:

3. Changing the Alignment of Data in Columns
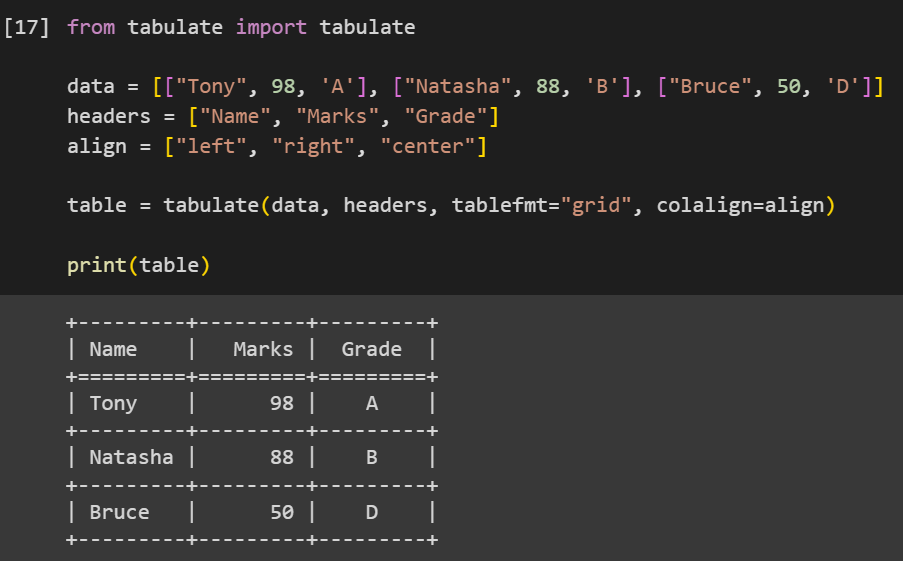
Now that we know how to create tables, we’ll learn how to customize and style them. A must-know customization is column alignment. tabulate() can take in an optional argument colalign which takes a list of alignments that can be either left, right or center.
Example:
from tabulate import tabulate

data = [["Tony", 98, 'A'], ["Natasha", 88, 'B'], ["Bruce", 50, 'D']]
headers = ["Name", "Marks", "Grade"]

align = ["left", "right", "center"]

table = tabulate(data, headers, tablefmt="grid", colalign=align)

print(table)
Here, most of the procedure followed is the same as that of Example 1. The only difference is that we have a list align containing 3 different alignments. These alignments will be applied to each of its respective columns. We then pass this list to colalign while creating the table using tabulate().
Output:

Conclusion
Using tabulate can save us the trouble of using external software for formatting data into tables. With its handy tabulate() function we can create tables from lists or dictionaries and also format them in various table formats using the tablefmt argument. We can also add other customizations like column alignment using the colalign to align columns to left, right or center. In this article, we’ve explored all of the above with some examples to better grasp the concept of tabulate() in Python.
Reference
https://stackoverflow.com/questions/55482252/printing-dict-as-tabular-data


