New to Rust? Grab our free Rust for Beginners eBook Get it free →
Node.js Monitoring with PM2

PM2’s error log can hold a stack trace even after the app is back online under a new process ID. I’m curious how much that trace can reveal about the failure without request-level timing.
Compare the app’s output with the signals PM2 records about its process. Start by checking the status and resource readings PM2 reports for a Node.js process.
What PM2 monitors in a Node.js process
PM2 manages the operating-system process that runs your Node.js app and reports its online state, CPU and memory use, uptime, and restart count in the process list.
Application performance monitoring (APM) adds request-level traces that PM2 process status does not provide. Your process can stay online while an endpoint fails.
| Signal | What PM2 shows | What it cannot establish alone |
|---|---|---|
| Process state | Whether the managed process is online, stopped, or restarting | Whether every route returns the response your callers expect |
| CPU and memory | Resource use for the Node.js process | Which request or dependency caused the load |
| Logs | Application output and errors written to stdout and stderr | Why a request was slow without app-level timing or traces |
What you need before you start
Run the sample in a Node.js project with npm available and port 3107 free, because the server binds only to loopback.
The sample includes a /crash route that deliberately throws an error so you can see how PM2 records a restart. Remove that test route before exposing the app to users.
- Node.js and npm are installed.
- You have a project directory where PM2 can be installed.
- Port 3107 is free on the machine running the example.
Monitor the Node.js process with PM2
This example uses Node’s built-in HTTP server, so you do not need Express or another web framework. It returns process memory on a health request and writes each request to the PM2 logs.
Step 1: Create the server
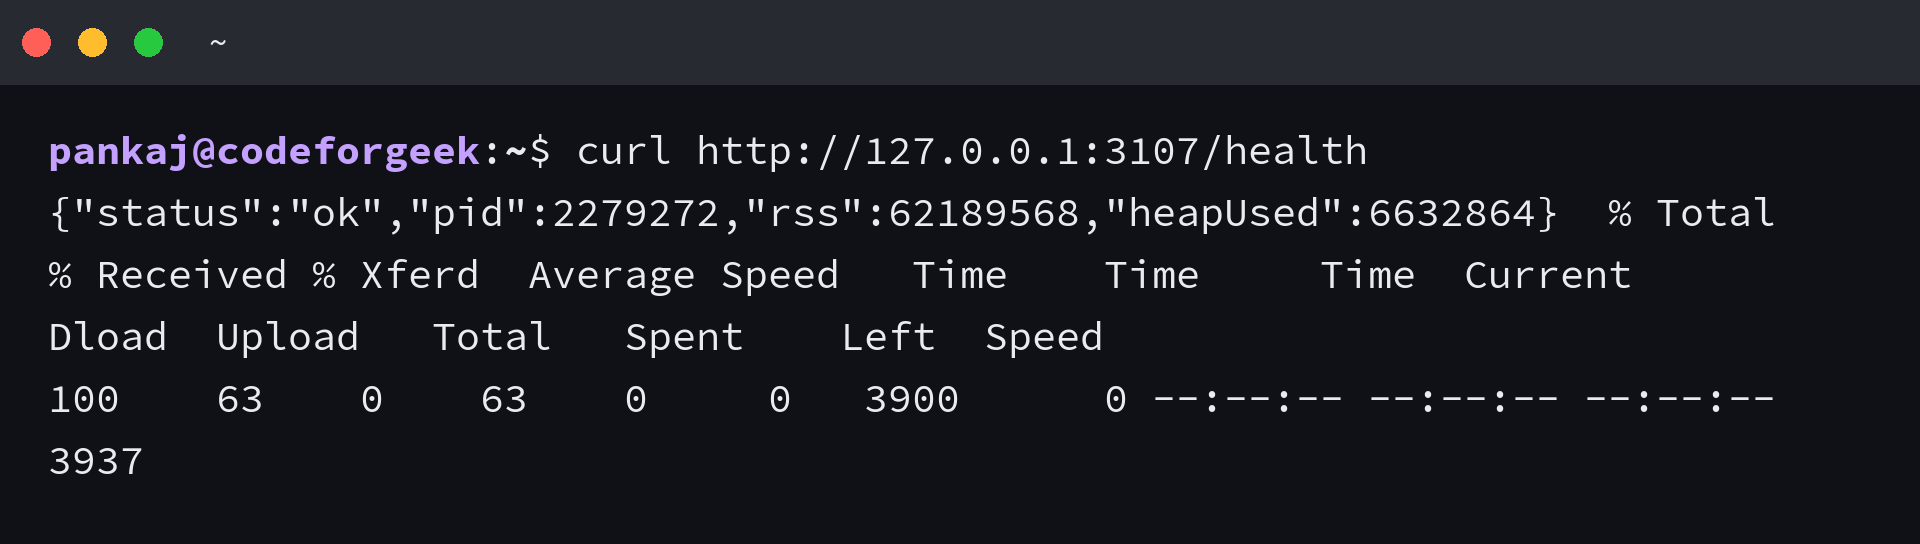
The health route returns a compact JSON response with the process ID and memory readings. The crash route is for a local test only because its unhandled error stops the Node.js process.
const { createServer } = require('node:http');

const server = createServer((req, res) => {
  const memory = process.memoryUsage();
  console.log(`${req.method} ${req.url} pid=${process.pid}`);

  if (req.url === '/health') {
    res.writeHead(200, { 'content-type': 'application/json' });
    res.end(JSON.stringify({
      status: 'ok',
      pid: process.pid,
      rss: memory.rss,
      heapUsed: memory.heapUsed
    }));
    return;
  }

  if (req.url === '/') {
    res.writeHead(200, { 'content-type': 'text/plain' });
    res.end('PM2 demo is running');
    return;
  }

  if (req.url === '/crash') {
    throw new Error('Intentional PM2 restart test');
  }

  res.writeHead(404, { 'content-type': 'text/plain' });
  res.end('Not found\n');
});

server.listen(3107, '127.0.0.1', () => {
  console.log(`listening on 3107 pid=${process.pid}`);
});
The RSS value is the process’s resident memory, while heapUsed is the JavaScript heap in use. Those numbers describe this process, not total host memory or whether its routes are correct.
PM2 starts a new process after the test route throws. The process ID changes, and the restart count increments.
The error log holds the stack trace. Restarting keeps the process available, but it does not make the failing request succeed.
Step 2: Set a memory threshold
An ecosystem file keeps the app name and memory threshold beside its startup configuration. The 300M value here is an example limit, not a recommendation for every service.
module.exports = {
  apps: [
    {
      name: 'pm2-monitor-demo',
      script: './app.js',
      max_memory_restart: '300M'
    }
  ]
};
PM2 checks the configured memory threshold about every 30 seconds and reloads a clustered app or restarts a single process after the limit is crossed, as the memory threshold guide documents.
Step 3: Install PM2 and start the app
Install PM2 in the project, then start the ecosystem file. PM2 registers the named process and returns control to the shell while the app keeps running.
npm install pm2
npx pm2 start ecosystem.config.js
npm audit reported two high-severity vulnerability entries for the PM2 7.0.4 dependency tree, both through js-yaml 4.3.1. npm suggested changing PM2 to 5.3.1, so check the advisory and your dependency tree before deploying instead of applying that downgrade automatically.
The ecosystem file gives this process an app-specific memory threshold that PM2 would not apply if you started the script without that configuration.
Step 4: Read health, status, and logs
Request the health route, inspect the PM2 process list, and read the app’s recent output. Use the interactive monitor when you want to keep the CPU and memory view open in the terminal.
curl http://127.0.0.1:3107/health
npx pm2 status
npx pm2 monit
npx pm2 logs pm2-monitor-demo --lines 10 --nostream
The status command gives you a snapshot, while the PM2 monitor keeps CPU and memory readings open in a live terminal panel. The log guide explains where PM2 saves stdout and stderr by default.
Trace a restart before changing the threshold
When I tested the demo’s /crash route, curl returned an empty reply and PM2 brought the process back under a new PID. The restart count rose from 0 to 1, but the route still failed.
| What you see | What to inspect next | What it tells you |
|---|---|---|
| Status is online but the route fails | Request the route and read the app’s error log | PM2 sees a running process. The application response still needs checking. |
| The restart count increases | Read the stderr log around the restart and inspect the failing code path | The process exited and restarted. The count does not identify the cause. |
| Memory crosses the configured threshold | Compare RSS over time and profile the app under its workload | PM2 can restart the process, but the threshold does not explain continued growth |
Node.js exits after an uncaught exception unless the process handles it. The Node.js process documentation limits an uncaughtException handler to synchronous cleanup before shutdown, so do not use it to resume normal request handling.
If the app restarts without a clear error, check the PM2 error log and the process details before changing restart settings. If the process stays online while requests fail, inspect the route and add application-level tracing for the request path.
Process health is not request health
PM2 tells you whether its child process is running and what resources that process uses. It does not prove that a request reached its handler, completed within your latency target, or got a useful response from a dependency.
PM2 Plus adds a hosted dashboard with exception tracking, notifications, and custom metrics for teams that monitor multiple servers. Local PM2 status and logs are enough to inspect one process from its host.
npx pm2 describe pm2-monitor-demo
Start with that process detail, then use the log entry to find the failing code path. Add request traces when the process stays online but the application’s behavior is still unclear.
PM2 monitoring FAQ
These answers cover the boundary between local PM2 process monitoring and the hosted dashboard.
Does PM2 monitor Node.js memory?
Yes. PM2 shows process memory in its CLI and can restart an app after a configured memory threshold. The threshold check runs on an interval, so the restart is not immediate.
Will PM2 identify why my process restarted?
No. Check the restart count and PM2 error logs, then trace the application error. PM2 supervises the process but does not diagnose the failing request handler.
Do I need PM2 Plus for local monitoring?
No. PM2 Runtime provides local process status, resource readings, and logs. PM2 Plus adds hosted monitoring features such as a web dashboard, notifications, and exception tracking.