New to Rust? Grab our free Rust for Beginners eBook Get it free →
LLM Latency Optimization for Developers (Speed Up Your AI Apps) | From Zero to AI Hero

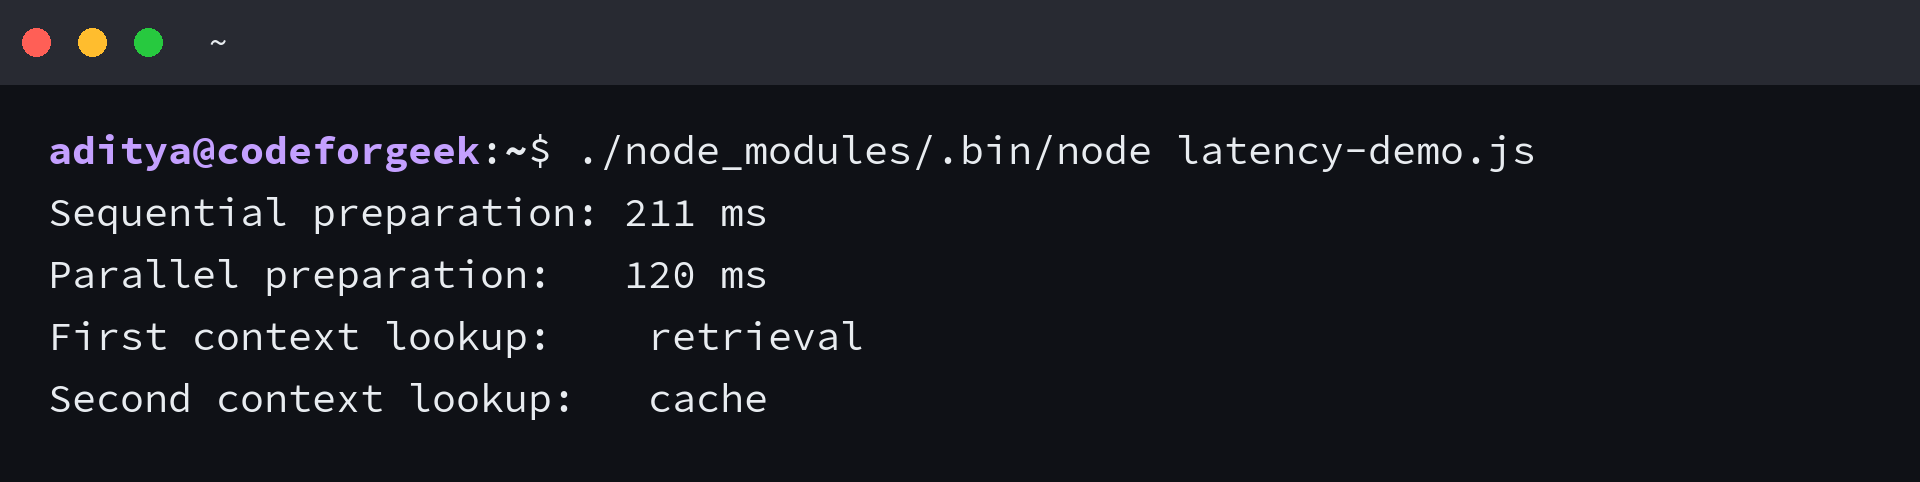
LLM latency optimization starts with separating model time from retrieval, network, and application work. The Node.js example below ran independent preparation steps in 121 ms on the parallel path and 211 ms on the sequential path, which makes orchestration the first place worth checking before you change models.
Measure the wait your user experiences
A single average hides the cause of a slow request. Track each stage independently, then inspect percentile values such as p50 and p95 because a fast median can coexist with painful tail latency.
The vLLM production metrics expose time to first token, inter-token latency, end-to-end request latency, prefill time, and decode time. Those measurements map cleanly to the questions you need to answer.
| Metric | What it measures | What usually changes it |
|---|---|---|
| Time to first token (TTFT) | Request arrival to the first generated token | Input length, queue time, retrieval, prefill, network distance |
| Inter-token latency | Delay between generated tokens | Model size, serving engine, hardware, batch pressure |
| End-to-end latency | Request arrival to complete response | Every stage plus output length |
| Throughput | Tokens or requests completed over time | Batching, concurrency, hardware utilization |
| Queue time | Time waiting for an inference slot | Traffic bursts, concurrency limits, oversized batches |
Interactive coding assistants usually need low TTFT and predictable p95 latency. Offline evaluation, indexing, and pull-request summaries can accept more waiting when batching raises total throughput.
Separate prefill, decode, and orchestration
Prefill processes the input tokens before generation begins, and retrieved files, tool results, conversation history, and system instructions can delay the first token even when the answer is short.
Decode generates the response token by token. Output length and model speed dominate this phase, which is why a request for a compact JSON decision often returns sooner than a long narrated review.
Orchestration covers vector search, database reads, policy checks, retries, and network hops, and a faster model cannot recover time lost to independent lookups that your application runs one after another.
Apply latency fixes in the order that pays
Start with changes that preserve answer quality and require little infrastructure work, then move to model serving changes only after the traces show that inference is the bottleneck.
Run independent preparation work concurrently
Retrieval and policy loading do not depend on each other in the example below. Promise.all starts both operations together, and the cache avoids repeating retrieval for the same file during the process lifetime.
const sleep = (ms) => new Promise((resolve) => setTimeout(resolve, ms));

async function retrieveContext() {
  await sleep(120);
  return "two relevant code snippets";
}

async function loadPolicy() {
  await sleep(90);
  return "security review policy";
}

async function runSequentially() {
  const started = performance.now();
  await retrieveContext();
  await loadPolicy();
  return Math.round(performance.now() - started);
}

async function runInParallel() {
  const started = performance.now();
  await Promise.all([retrieveContext(), loadPolicy()]);
  return Math.round(performance.now() - started);
}

const cache = new Map();
async function getContext(key) {
  if (cache.has(key)) return { source: "cache", value: cache.get(key) };
  const value = await retrieveContext();
  cache.set(key, value);
  return { source: "retrieval", value };
}

async function main() {
  console.log(`Sequential preparation: ${await runSequentially()} ms`);
  console.log(`Parallel preparation:   ${await runInParallel()} ms`);
  console.log(`First context lookup:    ${(await getContext("auth.js")).source}`);
  console.log(`Second context lookup:   ${(await getContext("auth.js")).source}`);
}

main().catch(console.error);
The measured result confirms the expected dependency behavior on Node.js 26.5.0. Treat the timings as a demonstration of the execution path, then measure your own stores and model endpoint under production traffic.
Stream the first useful token
Streaming sends generated tokens as they become available, so the interface can render progress before the full answer is complete. It improves perceived responsiveness but does not reduce the model’s total generation time.
Stream text for chat and explanations, but buffer structured outputs until the application has enough valid JSON to parse safely.
Reduce output before cutting useful context
OpenAI’s latency optimization guide puts generating fewer tokens ahead of trimming input in its seven-principle sequence. Set a response budget, request the schema you need, and stop asking the model to repeat evidence already visible in your interface.
Input reduction matters when prompts carry large files or long histories, so filter retrieved chunks by relevance, deduplicate repeated text, and keep stable instructions at the beginning when your provider supports prefix caching.
Route narrow tasks to smaller models
A smaller model can handle classification, formatting, or a constrained summary faster than a large reasoning model. Keep a task-level evaluation set so the latency gain does not hide missed security findings or broken code edits.
Specialization can help when the workload is stable, and Low-Rank Adaptation (LoRA) for code models is one route after prompting and routing fail the quality target.
Cache deterministic and repeated work
Cache repository metadata, unchanged embeddings, policy documents, and identical model responses only when their freshness rules are explicit. Include the model, prompt version, tenant, permissions, and relevant source revision in the cache key to prevent stale or cross-user answers.
Semantic caching needs a stricter review because two similar questions can require different security or repository context. Exact caching is the safer starting point for developer tools.
Batch background jobs, not keystrokes
Dynamic batching can raise GPU utilization and throughput, yet each request may wait for a batch window, so reserve it for pull-request backfills, evaluation suites, and indexing jobs rather than autocomplete.
Queue depth and p95 TTFT should control the batch limit because a throughput chart alone can reward a configuration that makes the interactive product feel slower.
Choose the next change from the trace
The slowest measured stage decides the next experiment, and changing several layers together makes the result hard to attribute while giving regressions more places to hide.
| Observed bottleneck | First change to test | Guardrail |
|---|---|---|
| High retrieval time | Run searches concurrently and reduce duplicate reads | Keep relevance and permission tests |
| High prefill time | Reduce repeated context and use stable cached prefixes | Preserve the evidence needed for the task |
| High decode time | Shorten the output or route to a faster model | Run the task-level quality set |
| High queue time | Tune concurrency or serving capacity | Watch p95 latency and error rate |
| Fast backend, slow interface | Stream useful output and remove blocking UI work | Do not expose invalid partial JSON |
Code retrieval deserves its own trace because chunk search can dominate a short response. The guide to code embeddings explains how the search layer supplies the context that prefill must process.
Keep a latency budget in production
Assign a budget to retrieval, prefill, decode, and application work, then alert on percentile breaches instead of averages. Record input tokens, output tokens, cache status, model route, retry count, and queue time with each trace so the next slowdown has evidence attached.
- Set separate service-level objectives for interactive and background workloads.
- Test warm and cold caches because the first request often follows a different path.
- Replay representative short, long, and tool-heavy prompts before changing a model route.
- Cap retries with a deadline so recovery logic cannot exceed the user-facing budget.
- Track quality beside latency so a faster response does not ship a weaker result.
If your product is an editor extension, compare these backend measurements with the steps in the GitHub Copilot workflow for Visual Studio Code. Interface timing determines whether streaming and partial results help the reader or merely add motion.
Frequently asked questions
What is the difference between latency and throughput?
Latency measures how long one request takes. Throughput measures how much work the system completes over a period, so batching can improve throughput even when it adds waiting to an individual request.
Which LLM latency metric should I check first?
Start with end-to-end latency and time to first token, then split the trace into queue, retrieval, prefill, and decode stages. The slowest stage tells you which optimization can change the result.
Does streaming make an LLM generate faster?
Streaming does not reduce total generation time. It lets your interface display tokens as they arrive, which reduces the wait before the user sees useful output.
Should I shorten the prompt or the response?
Shorten unnecessary output first for many interactive tasks, then remove repeated or irrelevant input when prefill is slow. Keep any context required for correctness, permissions, and source attribution.
When should I use batching?
Use batching when throughput matters more than immediate response, such as evaluation, indexing, and background pull-request processing. Keep batch windows small or disabled for autocomplete and other direct interactions.
A useful optimization changes a measured stage without weakening the task result, which is why every experiment needs the same replay workload and quality checks.
Make one change and measure again
Start with a trace from one representative request, remove the largest avoidable delay, and replay the same workload. That loop gives you an attributable latency improvement and a clear rollback point when quality or reliability moves the wrong way.