New to Rust? Grab our free Rust for Beginners eBook Get it free →
How to Debug a Java Application in Kubernetes Production

The heap graph shows a few hundred megabytes against a one gigabyte limit, the application log is empty, and the pod restarted with exit code 137 anyway.
I ran a small Java service in a 256 MiB container with a hard-coded heap size, and the container died at 232 MB of resident memory with a single startup line in its log. The container’s memory limit and the JVM’s heap are two separate budgets, and only one of them kills the process without saying anything.
Why a Java Pod Dies With a Flat Heap Graph
A Java process inside a container has two ceilings. The JVM enforces a maximum heap for itself, and the kernel enforces the cgroup memory limit that Kubernetes writes from the limit in the pod spec. Those are different numbers, counted by different software, and only one of them produces an error message.
The JVM is the first to notice its own ceiling, and when it reaches the maximum heap it prints a stack trace and can even write a heap dump before it exits. An OutOfMemoryError is what that looks like.
A container kill arrives from outside the JVM, and the kernel does not ask first. It sends SIGKILL, so the process never runs a shutdown hook and the container reports 128 plus 9, which is exit code 137.
| Budget | Who enforces it | What the failure looks like |
|---|---|---|
| Java heap, set by MaxHeapSize | The JVM | java.lang.OutOfMemoryError in the log, exit code 1, optional heap dump |
| Container memory, set by the cgroup memory.max value | The Linux kernel | SIGKILL, exit code 137, no line added to the log |
| Everything else the process maps | Nobody, until the cgroup fills | metaspace, thread stacks, JIT code cache, direct buffers, GC bookkeeping |
The third row is what makes a heap graph useless as a health check on its own. A heap sitting at 300 MB inside a 1 GiB limit still leaves the metaspace, several hundred thread stacks, the JIT code cache, and any off-heap buffer the application allocates to fit in the remaining 700 MB, and the kernel counts all of it.
Exit code 137 on its own proves only that the process received SIGKILL, which a failed liveness probe, a manual delete and a node eviction all produce. The termination reason is what separates them.
What You Need Before You Can Look Inside the Pod
Evidence collection depends on four things, and three of them are worth checking before the next restart rather than after it.
- Cluster access that allows the exec subresource on the pod. Read access to pods is not enough, and the RBAC rule you need is on pods/exec.
- An image that contains the JDK tools. jcmd, jstack and jmap ship in the JDK, so a runtime-only or distroless image has nowhere to run them from and the fallback is an ephemeral container.
- kubectl 1.25 or newer, which is where ephemeral containers became stable and where kubectl debug gained the target process namespace flag.
- A volume to write a heap dump to. A dump is roughly the size of the live set, and the container’s own writable layer is charged to the same limit that is killing you.
Is a restart affordable right now? That question comes before the commands, because a heap dump and a flight recording both cost memory and CPU.
On a pod that is already close to its limit those tools can cause the death they were meant to explain. A run of mine ended that way, with the dump stopping part way through and the container reporting OOMKilled in the same second.
The attach mechanism is the hidden dependency in every jcmd command below. jcmd reaches a running JVM through a socket that the target creates in its own temporary directory, and inside a container that handshake can fail for reasons unrelated to the command you typed. The thread-dump section has the fallback that does not need it.
If what you need is a debugger rather than a dump, the JDWP route means restarting the pod with an agent flag and forwarding the debug port. That is a maintenance-window tool: the port is unauthenticated, and a breakpoint pauses the threads that were serving live traffic.
Step 1: Read the Pod’s Account of Its Own Death
Kubernetes records the death before any of your tooling sees it. The status of the pod carries the reason, the exit code and the signal, and those three fields decide the next step you take.
I checked that record first on a pod that died while I was setting this up, and the fields were already complete: reason OOMKilled, exit code 137, restart count one.
Ask the Status for the Reason, the Exit Code and the Signal
This prints the last termination record for the first container in the pod, which is the one that died rather than the one now running.
$ kubectl get pod javademo-6f9b44f9f5-zhf5t \
    -o jsonpath='{.status.containerStatuses[0].lastState.terminated}'
{"containerID":"containerd://4633c245337c6385701fb80287a9b8388d513494a7b1961705fa4a13e1e24681",
 "exitCode":137,"finishedAt":"2026-09-16T13:20:08Z","reason":"OOMKilled",
 "startedAt":"2026-09-16T13:19:40Z"}
OOMKilled with exit code 137 and signal 9 is the kernel’s signature. Error with exit code 137 is the kubelet killing the container for a failed liveness probe, and a clean shutdown shows exit code 143, which is 128 plus 15 and means SIGTERM.
Read the Log From the Instance That Died
The running container has its own, newer log. The previous flag reaches back one restart to the instance that actually failed, which is the only log that matters after a kill.
$ kubectl logs javademo-6f9b44f9f5-zhf5t --previous
DebugDemo listening on 8080 maxHeap=989MB pid=1
Exit code 137 carries more than one meaning, so the reason field decides the branch you take.
| Reason on the container | Exit code | Who ended the process |
|---|---|---|
| OOMKilled | 137 | The kernel, after the container reached its cgroup memory limit |
| Error | 137 | The kubelet, after a liveness probe failed |
| Error | 143 | A graceful stop, which is SIGTERM and which a shutdown hook can catch |
| Completed | 0 | The process exited on its own before any probe ran |
| Evicted, on the pod rather than the container | 137 | The kubelet reclaiming node memory under pressure |
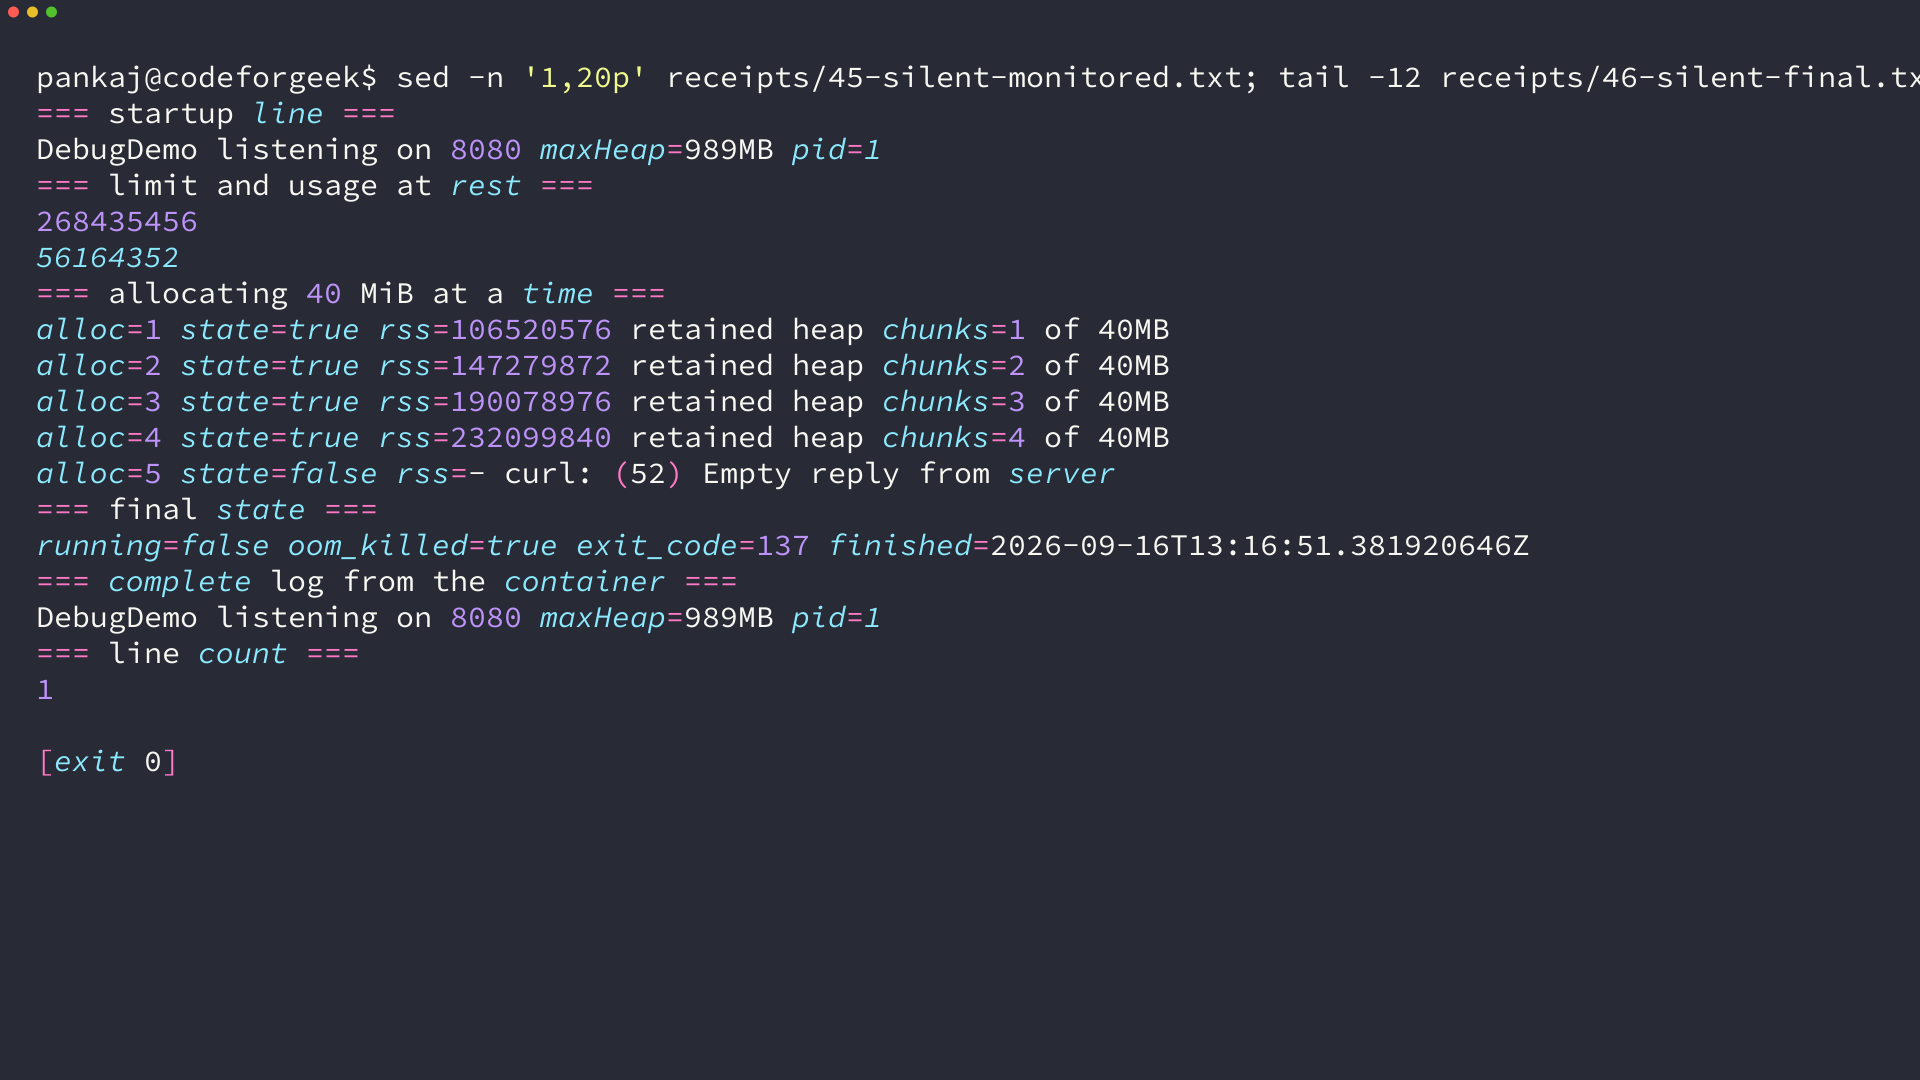
A single line of output and nothing after it is the result to expect from a memory kill. The kernel does not give the process a chance to write a farewell, so an empty tail is evidence rather than a logging bug. Reading events beside the log is the other half of this step, and the wider set of kubectl verbs covers the surrounding commands when you need to check a node or a deployment instead of one pod.
Step 2: Collect JVM Evidence From the Running Container
Once the pod is back, the same service is running with the same bug and the same clock ticking. These four commands take the evidence out of the live process while it is healthy enough to answer.
Read the Limit, the Heap and the Resident Set in One Pass
The first number is the budget the kernel enforces, and the second is what the process actually occupies inside it. Reading them together is what turns a flat heap graph into a diagnosis.
$ kubectl exec javademo-6f9b44f9f5-zhf5t -- sh -c \
    'cat /sys/fs/cgroup/memory.max; grep VmRSS /proc/1/status'
268435456
VmRSS:    116312 kB
The heap number comes from the JVM, and the flags line next to it shows how much room the JVM thinks it has.
$ java -XX:+PrintFlagsFinal -version | grep -E 'MaxHeapSize|MaxRAMPercentage'
   size_t MaxHeapSize      = 132120576    {product} {ergonomic}
   double MaxRAMPercentage = 25.000000    {product} {default}

$ jcmd <pid> GC.heap_info
garbage-first heap   total reserved 65536K, committed 65536K, used 7300K
 region size 1024K, 6 young (6144K), 0 survivors (0K)
When the resident set climbs and the heap stays flat, the growth is outside the heap, and no amount of garbage collection will release it. That is the state where monitoring says the heap is fine and the pod keeps dying.
Take a Thread Dump When the Process Is Alive but Stuck
A thread dump answers a different question from a heap dump. It shows what each thread is doing right now, which is how a thread pool exhausted by blocking calls is told apart from a leak.
$ jcmd <pid> Thread.print | grep -A3 '"demo-worker-12"'
"demo-worker-12" #43 [1087898] prio=5 os_prio=0 cpu=0.16ms elapsed=2.23s nid=1087898
   in Object.wait()  [0x0000e39ee0e30000]
   java.lang.Thread.State: WAITING (on object monitor)
        at java.lang.Object.wait0([email protected]/Native Method)
When the attach handshake is refused, the signal path is still open. The JVM treats SIGQUIT as a request to print every thread to its standard output, and the container’s standard output is what kubectl logs reads, so the dump lands in the log stream where you can keep it.
$ kubectl exec javademo-6f9b44f9f5-zhf5t -- kill -3 1
$ kubectl logs javademo-6f9b44f9f5-zhf5t | tail -4
Full thread dump OpenJDK 64-Bit Server VM (25.0.4+7-LTS mixed mode, sharing):
   java.lang.Thread.State: WAITING (on object monitor)
   java.lang.Thread.State: TIMED_WAITING (on object monitor)
   java.lang.Thread.State: RUNNABLE
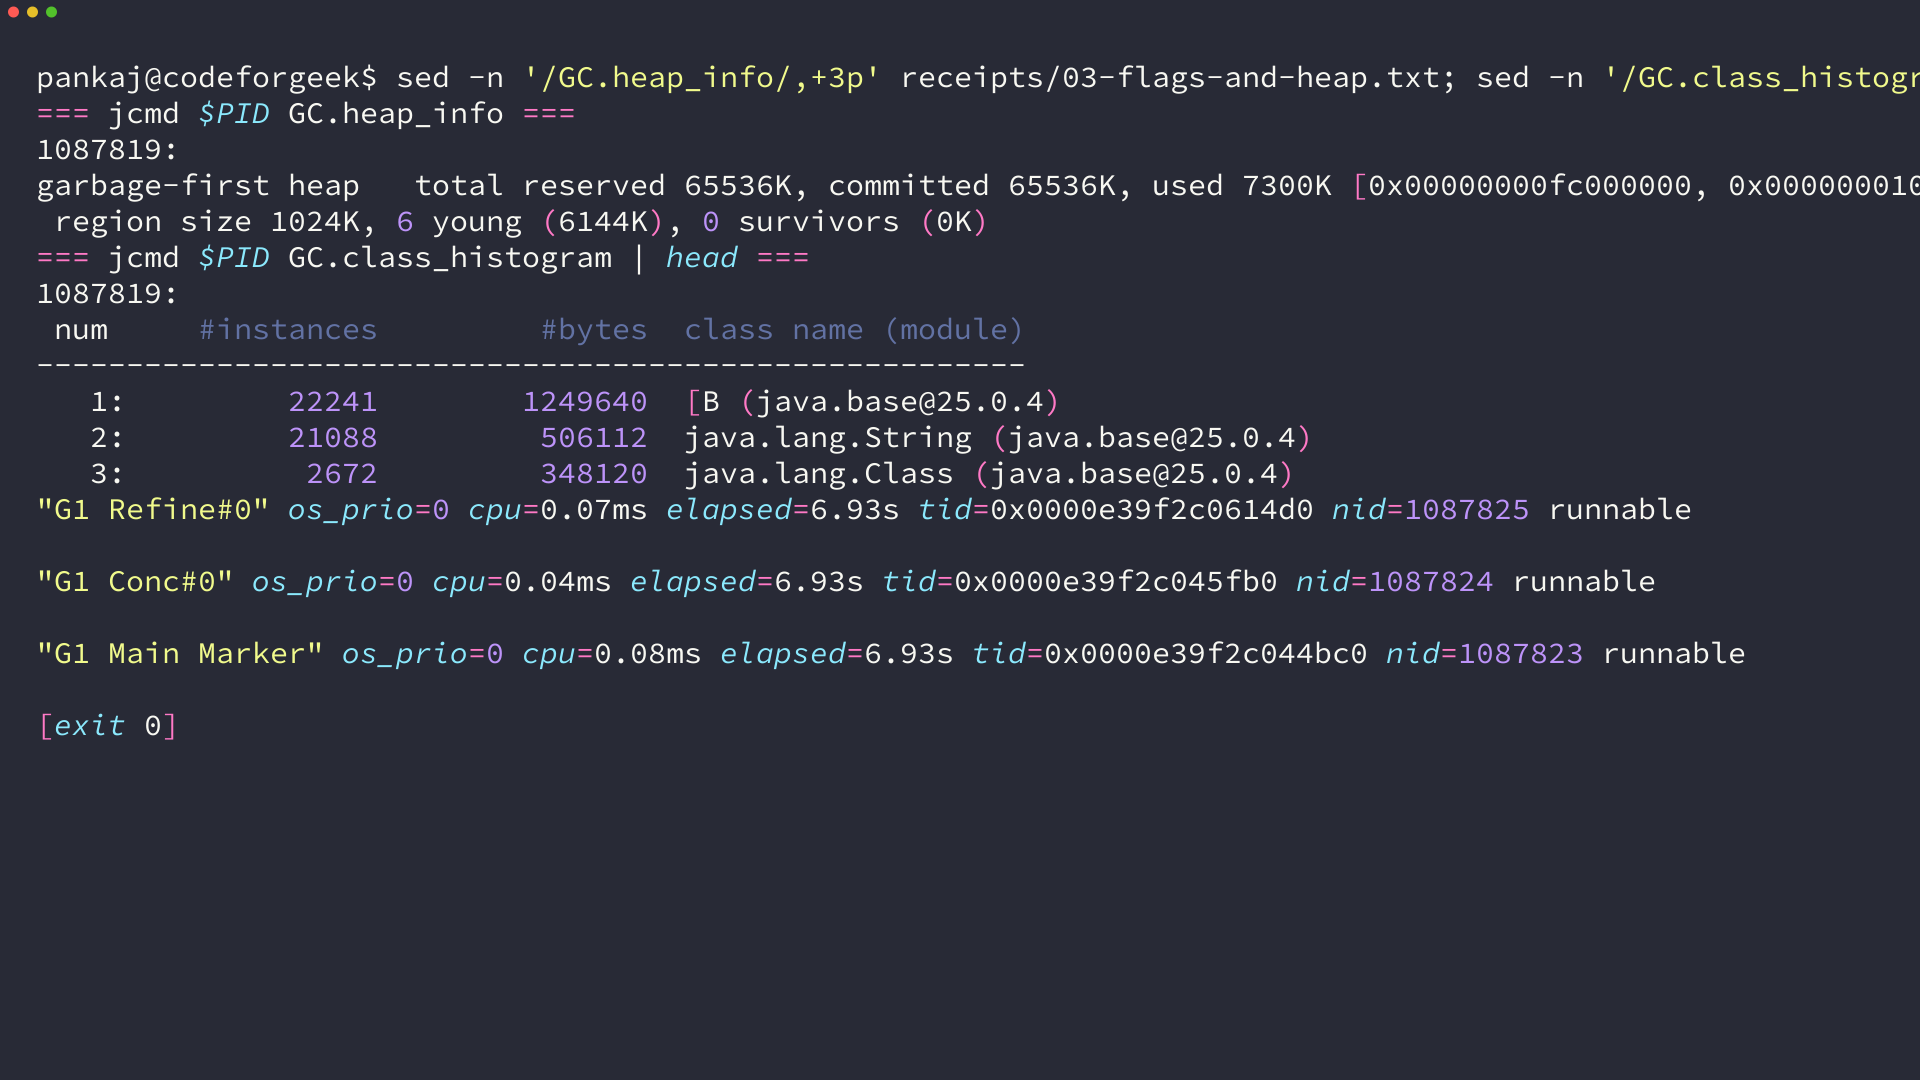
Sending that signal from outside the process does not need the attach socket, so it works in a container where jcmd fails, and it works for a JVM started long before you arrived. I used it that way after the attach call was refused on my container.
Capture a Heap Dump Before the Next Kill
A heap dump captures the live set at one instant. The command pauses the JVM while it writes, and the file stays inside the container unless you point it somewhere else.
$ jcmd <pid> GC.heap_dump /dumps/live.hprof
Dumping heap to /dumps/live.hprof ...
Heap dump file created [9616548 bytes in 0.054 secs]

$ jcmd <pid> GC.class_histogram | head -4
 num     #instances         #bytes  class name
-------------------------------------------------------
   1:         22241        1249640  [B
On a container that is already near its limit, the dump is a race against the OOM killer, and writing it to the container layer makes it worse because that write is charged to the same budget. Mount a volume at the dump path so the file outlives the container.
A production heap of several gigabytes is a different calculation. I ran the dump on a live process holding a small heap and the write finished in a fraction of a second, which is the cheap case.
Start a Recording You Can Keep
A flight recording is the only artifact here that survives the pod without you being awake when it dies. It samples the JVM and the process’ surroundings on a rolling buffer, so the interesting minute is already in the file when the process disappears.
$ jcmd <pid> JFR.start name=diag filename=/dumps/diag.jfr settings=profile
Started recording 1. No limit specified, using maxsize=250MB as default.
$ jcmd <pid> JFR.dump name=diag filename=/dumps/diag.jfr
Dumped recording "diag", 266.2 kB written to:
/dumps/diag.jfr

$ jfr summary /dumps/diag.jfr | grep -E 'ResidentSetSize|NativeMemory|ObjectAllocationSample'
 jdk.NativeMemoryUsageTotal                   6             96
 jdk.ResidentSetSize                          6             90
 jdk.ObjectAllocationSample                  39            550
Resident set size and native memory in the same file as the allocation samples is the combination that matters here, because it puts the kernel’s number beside the JVM’s.
Step 3: Make the JVM Report the Failure Before the Kernel Does
Everything above collects evidence after a death. The flags below change the death itself so the next one leaves a record, and they are set where the container is defined.
Size the Heap From the Limit Instead of Hard-Coding It
The JVM reads the container limit at startup and picks a default heap from it. The arithmetic is documented: the maximum usable memory is the lower of physical memory and any container constraint, the default MaxRAMPercentage is 25 percent, and MinRAMPercentage is 50 percent for small heaps of roughly 125 MB.
| Container limit | Heap the JVM chose, JDK 25, default flags |
|---|---|
| 128 MiB | 64 MiB |
| 256 MiB | 126 MiB |
| 512 MiB | 128 MiB |
| 1024 MiB | 256 MiB |
| no limit on an 8 GB host | 1.9 GiB |
The 256 MiB row is where the small-heap rule applies, so about half the container is handed to the heap and the other half has to cover metaspace, threads, the code cache and everything the application allocates off-heap. I measured 126 MiB from a 256 MiB limit with no flags set, which leaves 130 MiB for the rest of the process.
A hard-coded maximum overrides all of that. It is the usual reason a Java pod ends up outside its own limit, and the manifest below leaves the heap as a percentage of the limit instead while keeping the dump off the container layer.
spec:
  containers:
    - name: app
      image: registry.example.com/java-service:2026.09
      args:
        - -XX:MaxRAMPercentage=60
        - -XX:+HeapDumpOnOutOfMemoryError
        - -XX:HeapDumpPath=/dumps
      resources:
        requests:
          memory: "256Mi"
        limits:
          memory: "256Mi"
      volumeMounts:
        - name: dumps
          mountPath: /dumps
  volumes:
    - name: dumps
      emptyDir: {}
At 60 percent of a 256 MiB limit the JVM here gave itself a maximum heap of 148 MB, which leaves about 100 MB for the rest of the process. That is headroom rather than a guarantee, and the parts have to sum to less than the limit for the container to survive a heap that fills.
Keep the Dump Where a Restart Cannot Reach It
An emptyDir volume is mounted into the pod rather than the container, so what the JVM writes there is still readable after the container is gone. On the pod that carried the flags above, the JVM reached its own heap limit, wrote the dump, and the container was never killed.
$ kubectl logs deploy/javademo-aware --tail=3
Exception in thread "pool-1-thread-3" java.lang.OutOfMemoryError: Java heap space
Exception in thread "pool-1-thread-4" java.lang.OutOfMemoryError: Java heap space
Exception in thread "pool-1-thread-5" java.lang.OutOfMemoryError: Java heap space

$ kubectl exec deploy/javademo-aware -- ls -l /dumps
-rw------- 1 root root 131573923 Sep 16 13:21 java_pid1.hprof
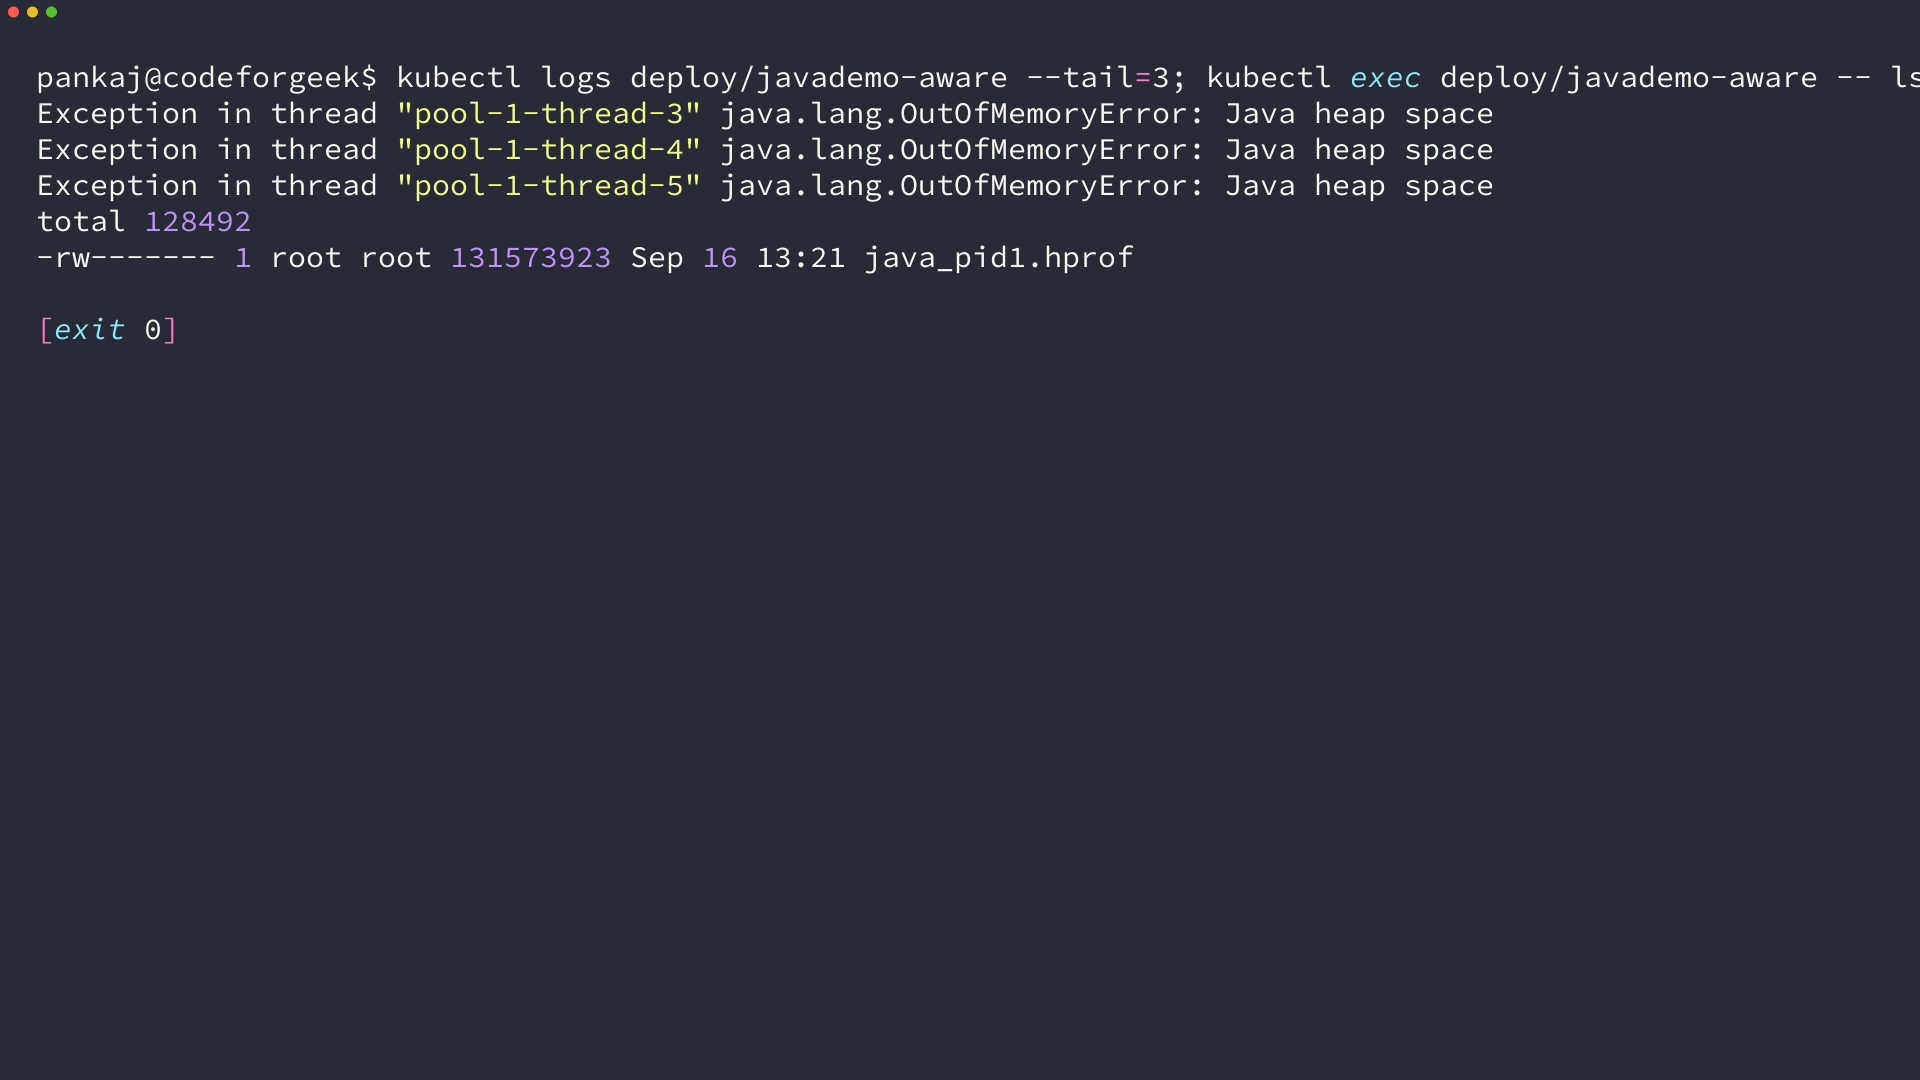
Copy the file out with kubectl cp before the pod is deleted, because deleting the pod takes the emptyDir with it. A command-line reader is enough to see the largest classes, and Eclipse MAT or VisualVM open the same file for the object graph.
Read the Artifact After the Pod Is Gone
The recording and the dump are ordinary files, and they answer different questions. The histogram ranks what is occupying the heap right now, and the recording replays everything around the failure, including the resident set that the kernel was watching.
$ jcmd <pid> GC.class_histogram | head -4
 num     #instances         #bytes  class name (module)
-------------------------------------------------------
   1:         22241        1249640  [B ([email protected])
   2:         21088         506112  java.lang.String ([email protected])
   3:          2672         348120  java.lang.Class ([email protected])
Where This Path Breaks
Every one of these showed up in the runs behind the screenshots below, and each has a different fix rather than a retry. The toolkit around these commands is worth knowing once the single-pod case is handled.
- An image with no shell. A distroless image answers kubectl exec with nothing to run. An ephemeral container attached to the same process namespace is the way in, and the target flag is what makes the JVM visible from inside it.
- An image with no JDK tools. jcmd, jstack and jmap are not part of a runtime-only image, so the heap and thread commands have to run from a container that has them.
- An attach that is refused. A jcmd call from another process inside the container can fail with a permission error before it reaches the JVM at all. The SIGQUIT path and the startup recording both work without the attach socket.
- A dump that triggers the kill. When the heap is already near the limit, the write itself can push the container over. I saw the log line announcing the dump, then a truncated file next to an OOMKilled container, which is why the dump belongs on a volume and the heap needs headroom.
- A stale heap flag. A maximum left in a deployment template from before the memory limit was added wins over every default the JVM would have picked from the cgroup.
- A crash loop that erases its own evidence. The last termination record belongs to the latest death, and a container that restarts quickly overwrites the log you were about to read. Starting the recording at boot instead of reaching for it after the third restart.
The ephemeral-container route for the first two cases points the target flag at the container that holds the JVM.
$ kubectl debug -it javademo-6f9b44f9f5-zhf5t \
    --image=eclipse-temurin:25-jdk --target=app
Targeting container "app". If you don't see processes from this container it may be
because the container runtime doesn't support process namespace sharing.
Leave the Recording Running
The failure worth configuring for is the one that leaves no trace, because it removes your ability to work on it after the fact. The two flags below turn a silent kill into a diagnosable one, and they cost nothing while the service is healthy.
-XX:+HeapDumpOnOutOfMemoryError -XX:HeapDumpPath=/dumps
Point the path at a mounted volume rather than the container layer, keep the heap as a percentage of the limit so the JVM and the kernel are arguing about the same number, and the next restart arrives with an artifact instead of a rumour.
Does exit code 137 always mean the container ran out of memory?
No. Exit code 137 is 128 plus 9, so it only means the process received SIGKILL. A failed liveness probe, a manual delete and a node eviction produce the same number. The termination reason is what separates them, and it reads OOMKilled only for a memory kill.
Why is there no OutOfMemoryError in the log?
Because the kernel killed the process before the JVM could detect a problem. The JVM raises an OutOfMemoryError when it reaches its own heap limit, and a container kill happens outside that limit. A process that is killed by SIGKILL never runs a shutdown hook or writes a final log line.
Where does a heap dump go when the container restarts?
Wherever HeapDumpPath points. If that path is inside the container’s own filesystem the file survives for as long as the container does, which is usually seconds. A volume mounted at that path belongs to the pod, so the file is still there after the container is replaced, but deleting the pod removes it.
Can jcmd run inside a container?
It can, and it is the fastest way to read the heap and the flags. It depends on the JVM’s attach mechanism, which uses a socket in the target’s temporary directory and can be refused inside a container. Sending SIGQUIT to the process and reading the container log is the fallback that does not need the socket.
Why does the heap look healthy while the container keeps getting killed?
The heap is one budget and the cgroup limit is another. Metaspace, thread stacks, the JIT code cache, direct buffers and the JVM’s own bookkeeping are all counted by the kernel and none of them appear in a heap graph. Compare the resident set in the process status with the memory limit in the cgroup before concluding the heap is innocent.
Does raising the memory limit fix it?
It moves the failure later and makes it bigger. The kill returns when traffic, file size or heap growth catches up with the number, which is why the same report keeps arriving from teams whose pods restart every few hours. Aligning the heap with the limit and keeping a dump gives you the cause instead of a postponement.