
New to Rust? Grab our free Rust for Beginners eBook Get it free →
Visualize Server traffic using logstalgia


Web Server traffic visualization seems boring to do using raw logs. Logs contains textual information about request and response with code. I stumbleupon to one package called logstalgia which visualize the access logs graphically. It visualizes the traffic in form of ping pong game !
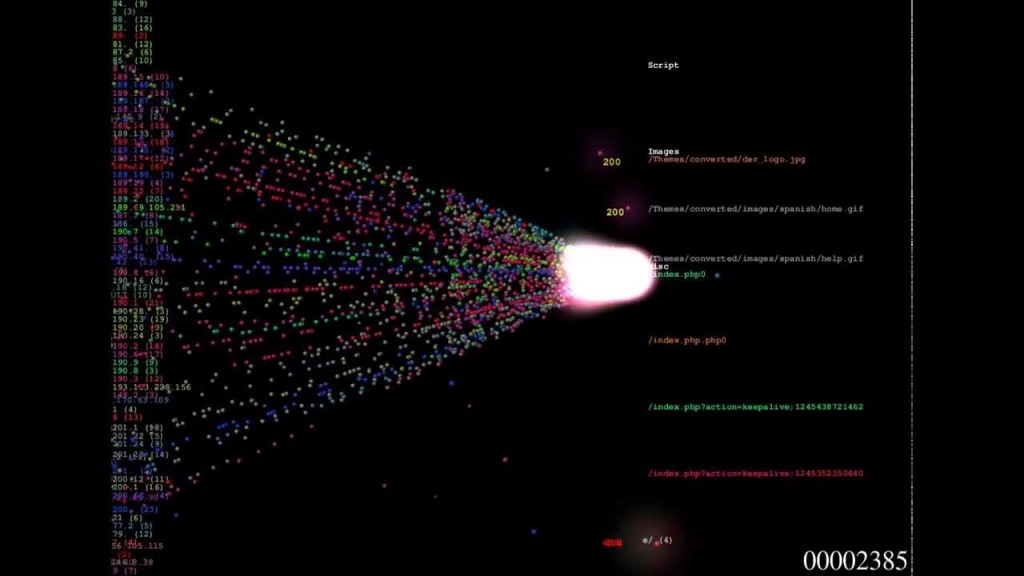
How to Install logstalgia:
Make sure you have access log file reside in “xampp/apache/logs” folder with you or if not you can download one from here.
To install logstalgia on Windows Operating System just download the compile software from here.
Unzip it and run the logstalgia.exe file. It will ask you to choose your access_log file and once done it will start showing you visualization of your traffic.
To install logstalgia on Ubuntu 14.04 run following commands one by one.
sudo apt-get update
sudo apt-get install logstalgia
sudo logstalgia /opt/lampp/logs/access_log
You can change the path of access_log according to your location.
How to run logstalgia:
It’s easy to run on Windows, all you need to do is click on .exe file and select your access log.
In Ubuntu provide the path of access log in terminal with logstalgia command.
Working Video : Just for fun