New to Rust? Grab our free Rust for Beginners eBook Get it free →
Kubernetes Troubleshooting Tools Your DevOps Team Should Use

A pod that keeps dying has already written down why. The exit code, the event list, and the container’s last line of output are sitting in the cluster, one command apart.
Kubernetes troubleshooting tools earn their install when they reach evidence the built-in commands cannot, and not before. I broke four workloads on a throwaway cluster to find where that line falls.
Why the evidence comes before the tool
A failure leaves three kinds of record, and each one captures a different part of it. The pod object holds what the control plane decided, the event stream holds what each component tried, and the container’s output holds what your process did with its turn.
They were produced in that order, so read them in that order. A dashboard that shows all three at once hides which question you are asking.
| Evidence | Where it lives | First command | Question it answers |
|---|---|---|---|
| Pod phase and conditions | the pod object’s status | kubectl get pod | Did it schedule, and what state is it in |
| Last exit code and reason | containerStatuses lastState | kubectl get pod -o jsonpath | Why the previous attempt stopped |
| Events | kubelet and control plane | kubectl describe pod or kubectl events | What the cluster tried and could not finish |
| Container output | the container runtime’s log store | kubectl logs | What the process printed before it stopped |
Every command in that table ships with kubectl, so a first pass over an incident needs no install at all. A tool earns its place when a question survives all four rows unanswered.
What you need before the first command
The commands here ran against a kubectl v1.37.0 client talking to a v1.37.0 cluster. The client tolerates a server one minor version either side of it, so a v1.36 or v1.38 cluster takes the same sequence.
Beyond a kubeconfig that points at the failing cluster, you need these permissions:
- read access to the namespace, which covers the pod object and the event list
- pods/log for the container output
- pods/exec for anything that opens a shell inside a container
- pods/ephemeralcontainers for the debug container path, which many locked-down clusters never grant to application developers
- cluster-admin or an equivalent role for the node-level path
If your permissions stop at the namespace edge, the pod paths still work and the node path is the one to hand to whoever owns the cluster.
Work a Kubernetes failure from the symptom to the cause
The symptoms that land on a DevOps on-call rotation come down to a handful of shapes, and each one has a first command that answers it. Match the symptom, run the command, and stop as soon as the output names a cause.
A pod that is restarting
CrashLoopBackOff means the container started, exited, and started again, so the cluster already holds the exit code.
kubectl get pods -n shop
NAME                        READY   STATUS             RESTARTS         AGE
api-gateway                 1/1     Running            0                4m12s
batch-import                0/1     Pending            0                10m
checkout-66f4c7c867-hcrtn   0/1     Error              7 (5m13s ago)    11m
checkout-66f4c7c867-qsgfq   0/1     Error              7 (5m44s ago)    11m
checkout-debug              0/2     CrashLoopBackOff   12 (3m30s ago)   9m21s
payments                    0/1     CrashLoopBackOff   6 (2m29s ago)    9m59s
report-worker               0/1     ImagePullBackOff   0                10m
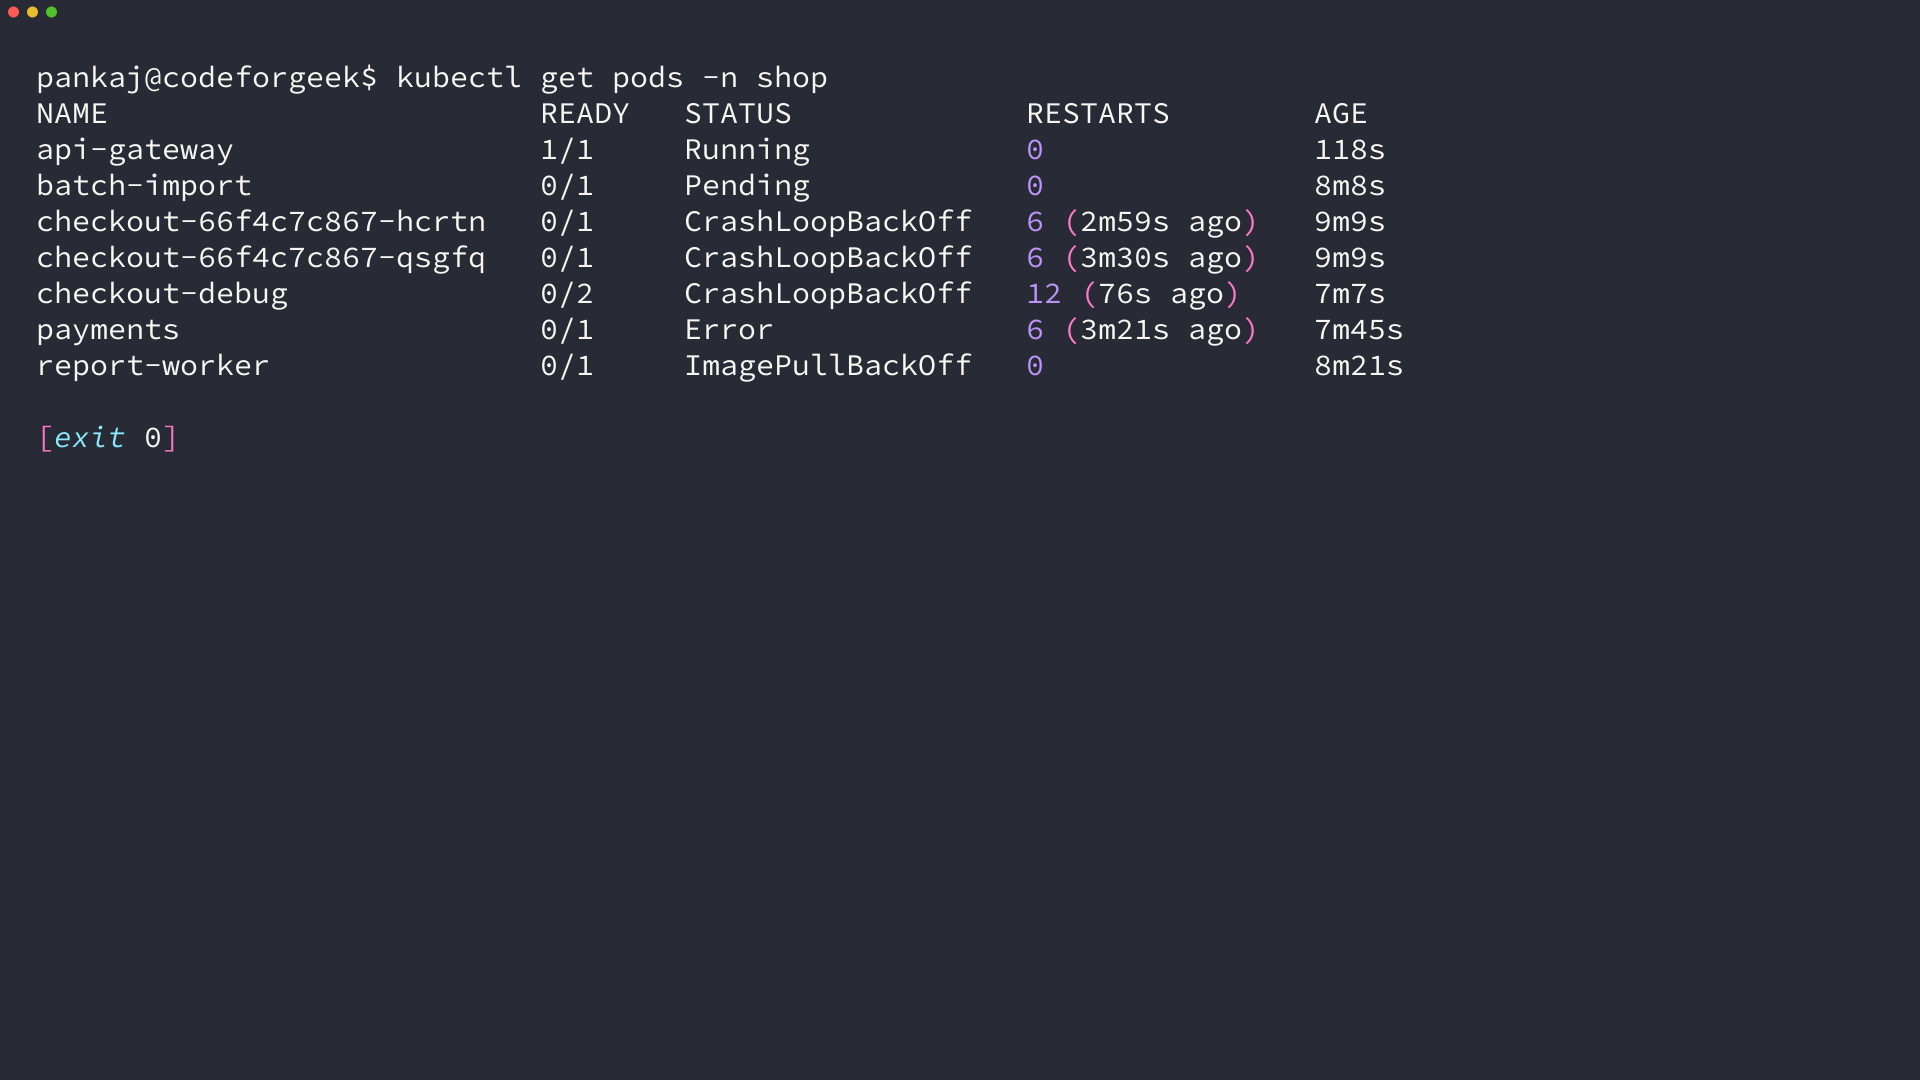
The status column splits the cases before you read anything else. CrashLoopBackOff says the process ran and stopped, ImagePullBackOff says it never started, and Pending says the scheduler never placed it on a node.
The exit code from the last attempt is the single fact that decides where you look next.
kubectl get pod -n shop payments -o jsonpath='{.status.containerStatuses[0].lastState.terminated}'
{"containerID":"containerd://9c96bce0862a7032309e3c57cc17f5df9936e242697cdaaf2e7f0a82d66ed962","exitCode":1,"finishedAt":"2026-09-16T14:13:33Z","reason":"Error","startedAt":"2026-09-16T14:13:21Z"}
Exit 1 is your program reporting a failure. Exit 137 is a SIGKILL, which in a container usually means the kernel enforced a memory limit, and that same field then reads OOMKilled instead of Error. Exit 143 is a SIGTERM from a shutdown, and 139 is a segmentation fault.
That single value sends you to four different places, so the crash loop path starts here rather than at a tool. When you want the wider flag surface for those reads, the kubectl command reference on this site covers it.
I expected the previous container’s output to hold the error message, and that expectation was wrong.
kubectl logs -n shop payments --previous
payments: warming cache
payments: panic: ledger lock timeout
Previous output is served by the container runtime rather than by the pod object, and the runtime removes it along with the dead container. The same command answered with the lines above on one attempt and with nothing but this line on another: unable to retrieve container logs for containerd://2023bc59d85c04ac9caf9a2c7e76cb6b3f99f9f75b867e5332adc27e418011db.
Because that store is temporary, the exit code and the event reason are the parts of the record that survive, and they are usually enough to route the incident.
The event list is the cluster’s own account of what it tried.
kubectl events --for pod/payments -n shop --types=Warning
LAST SEEN            TYPE      REASON    OBJECT         MESSAGE
27s (x11 over 11m)   Warning   BackOff   Pod/payments   Back-off restarting failed container payments in pod payments_shop(c0878e60-5038-4649-b3ad-1a81dd252bb5)
BackOff paired with a rising restart count is the signature of a crash loop rather than a one-off exit. Read it next to the exit code and you have the shape of the failure before you open a single log line.
An image that will not pull
ImagePullBackOff reads straight off the event message, because the kubelet copies the registry response into it. I put a deliberately broken tag on a pod to see which reason appeared first.
kubectl events --for pod/report-worker -n shop
LAST SEEN             TYPE      REASON      OBJECT              MESSAGE
10m                   Normal    Scheduled   Pod/report-worker   Successfully assigned shop/report-worker to cfg-control-plane
7m22s (x5 over 10m)   Normal    Pulling     Pod/report-worker   Pulling image "busybox:1.36.1-not-a-real-tag"
7m21s (x5 over 10m)   Warning   Failed      Pod/report-worker   Failed to pull image "busybox:1.36.1-not-a-real-tag": rpc error: code = NotFound desc = failed to pull and unpack image "docker.io/library/busybox:1.36.1-not-a-real-tag": failed to resolve reference "docker.io/library/busybox:1.36.1-not-a-real-tag": docker.io/library/busybox:1.36.1-not-a-real-tag: not found
7m21s (x5 over 10m)   Warning   Failed      Pod/report-worker   Error: ErrImagePull
30s (x42 over 10m)    Normal    BackOff     Pod/report-worker   Back-off pulling image "busybox:1.36.1-not-a-real-tag"
30s (x42 over 10m)    Warning   Failed      Pod/report-worker   Error: ImagePullBackOff
The kubelet reports this in three states for one underlying problem. ErrImagePull is the first failure, ImagePullBackOff is the retry back-off, and in practice the same two warnings repeat with a growing age until someone changes the tag.
The cause sits in the last line of the message. Here the tag does not exist in the registry, and the response says so in as many words.
A pod that never schedules
A Pending pod never reached a container runtime, so there are no logs and no exit code to read. The scheduler leaves its reasoning on the pod condition instead.
kubectl get pod -n shop batch-import -o jsonpath='{.status.conditions[?(@.type=="PodScheduled")].message}'
0/1 nodes are available: 1 Insufficient cpu, 1 Insufficient memory. preemption: 0/1 nodes are available: 1 Preemption is not helpful for scheduling.
I sized that pod at 8 CPUs and 32Gi on purpose to make the scheduler refuse it. The message names every node and the reason it rejected the pod, so it can report two shortages at once.
kubectl describe node shows the same numbers as allocatable and allocated, which is where you check whether the request is unrealistic or the node is genuinely full.
A container with no shell
Distroless and scratch images carry no shell, so kubectl exec has nothing to open inside them. The debug container path adds a second container to a running pod instead, in the target’s process namespace.
kubectl debug -n shop api-gateway --image=busybox:latest --target=api --attach=false -- sh -c 'echo "from the debug container"; ps -o pid,comm | head -6'
Targeting container "api". If you don't see processes from this container it may be because the container runtime doesn't support this feature.
Defaulting debug container name to debugger-g55nh.
The generated name matters, because kubectl logs rejects the plain debugger alias and accepts only the suffixed one.
kubectl logs -n shop api-gateway -c debugger-sv4mf
from the debug container
PID   COMMAND
    1 pause
    7 sh
   21 sleep
   22 sh
   35 ps
That process list is the proof the debug container sees the target’s processes rather than its own, and it depends on shareProcessNamespace being set on the pod.
The same command failed when I aimed it at a crash-looping pod:
failed to generate container "7c3b69c4f19f3f99de69a267cbc6712ee40b7d06fd4caa265ac944bc69a1ead3" spec: failed to generate spec opts: invalid target container: container "a3084a2db1fea280d65f1586c3b6c583cfa1246f518a34fda0ef44b473a4bd6e" is not running - in state CONTAINER_EXITED
An ephemeral container needs a target container that is still running. It suits a live process that is misbehaving, so a pod that keeps dying belongs in the crash loop path above instead.
When the misbehaving process is a JVM, the reach of a debug container changes again, and the walkthrough on debugging a Java application in Kubernetes production covers the flags, dumps and attach permissions that apply.
The node is the problem
A NotReady node, or one whose kubelet stopped posting, needs the same trick one level down.
kubectl debug node/cfg-control-plane --image=busybox:latest --attach=false -- sleep 3600
Creating debugging pod node-debugger-cfg-control-plane-jpsqs with container debugger on node cfg-control-plane.
That pod starts in the host namespaces with the node’s filesystem mounted at /host, which is what puts the kubelet and the container runtime within reach.
kubectl exec -n default node-debugger-cfg-control-plane-jpsqs -- ls /host/etc/kubernetes/manifests
etcd.yaml
kube-apiserver.yaml
kube-controller-manager.yaml
kube-scheduler.yaml
Those four manifests are the static pods that make up the control plane, and editing one in place is how you repair a control plane that will not start at all.
The debug container needs a long-running command, because the default one exits immediately and leaves a completed pod that refuses exec, and a non-root process cannot read the host root without extra capabilities. Each one blocks a different repair.
kubectl describe node is the read-only path when you cannot create a debug pod at all. Its conditions block reports memory, disk and PID pressure plus the kubelet’s own heartbeat, which is what separates a busy node from a dead one.
The tools that take over when kubectl stops answering
Each tool below answers a question the commands above raise and cannot settle, so I checked the release date of every one before writing it down, because a recommendation without that check ages badly.
| Tool | Job during an incident | Version tested | Last release |
|---|---|---|---|
| stern | stream logs from several pods at once | v1.34.0 | 2026-05-02 |
| k9s | browse cluster objects in a terminal | v0.51.0 | 2026-06-06 |
| metrics-server | supply the metrics API behind kubectl top | v0.9.0 | 2026-07-13 |
| popeye | scan objects for problems before they break | v0.22.1 | 2025-01-28 |
| Helm | hold the release history and roll back | v4.3.0 | 2026-09-09 |
| kube-prometheus | store and query the time series | v0.18.0 | 2026-06-18 |
| kube-state-metrics | expose object state as series | v2.20.0 | 2026-08-18 |
| Komodor | assemble a change timeline | commercial | n/a |
| Kubewatch | archived, do not adopt | none | 2020-07-03 |
| Gitkube | unmaintained since 2020, do not adopt | none | 2020-04-09 |
The releases API for a project gives the last release date and whether the repository is archived. That is a few seconds of work and the difference between a working pointer and a dead end.
Stream every pod’s log at once
stern tails several pods and containers with one command, which matters when a request crosses four services and only one of them is unhappy.
stern -n shop --tail 2 --no-follow --selector app=checkout
+ checkout-66f4c7c867-qsgfq › checkout
+ checkout-66f4c7c867-hcrtn › checkout
checkout-66f4c7c867-hcrtn checkout checkout: connecting to redis:6379
- checkout-66f4c7c867-hcrtn › checkout
checkout-66f4c7c867-qsgfq checkout checkout: connecting to redis:6379
- checkout-66f4c7c867-qsgfq › checkout
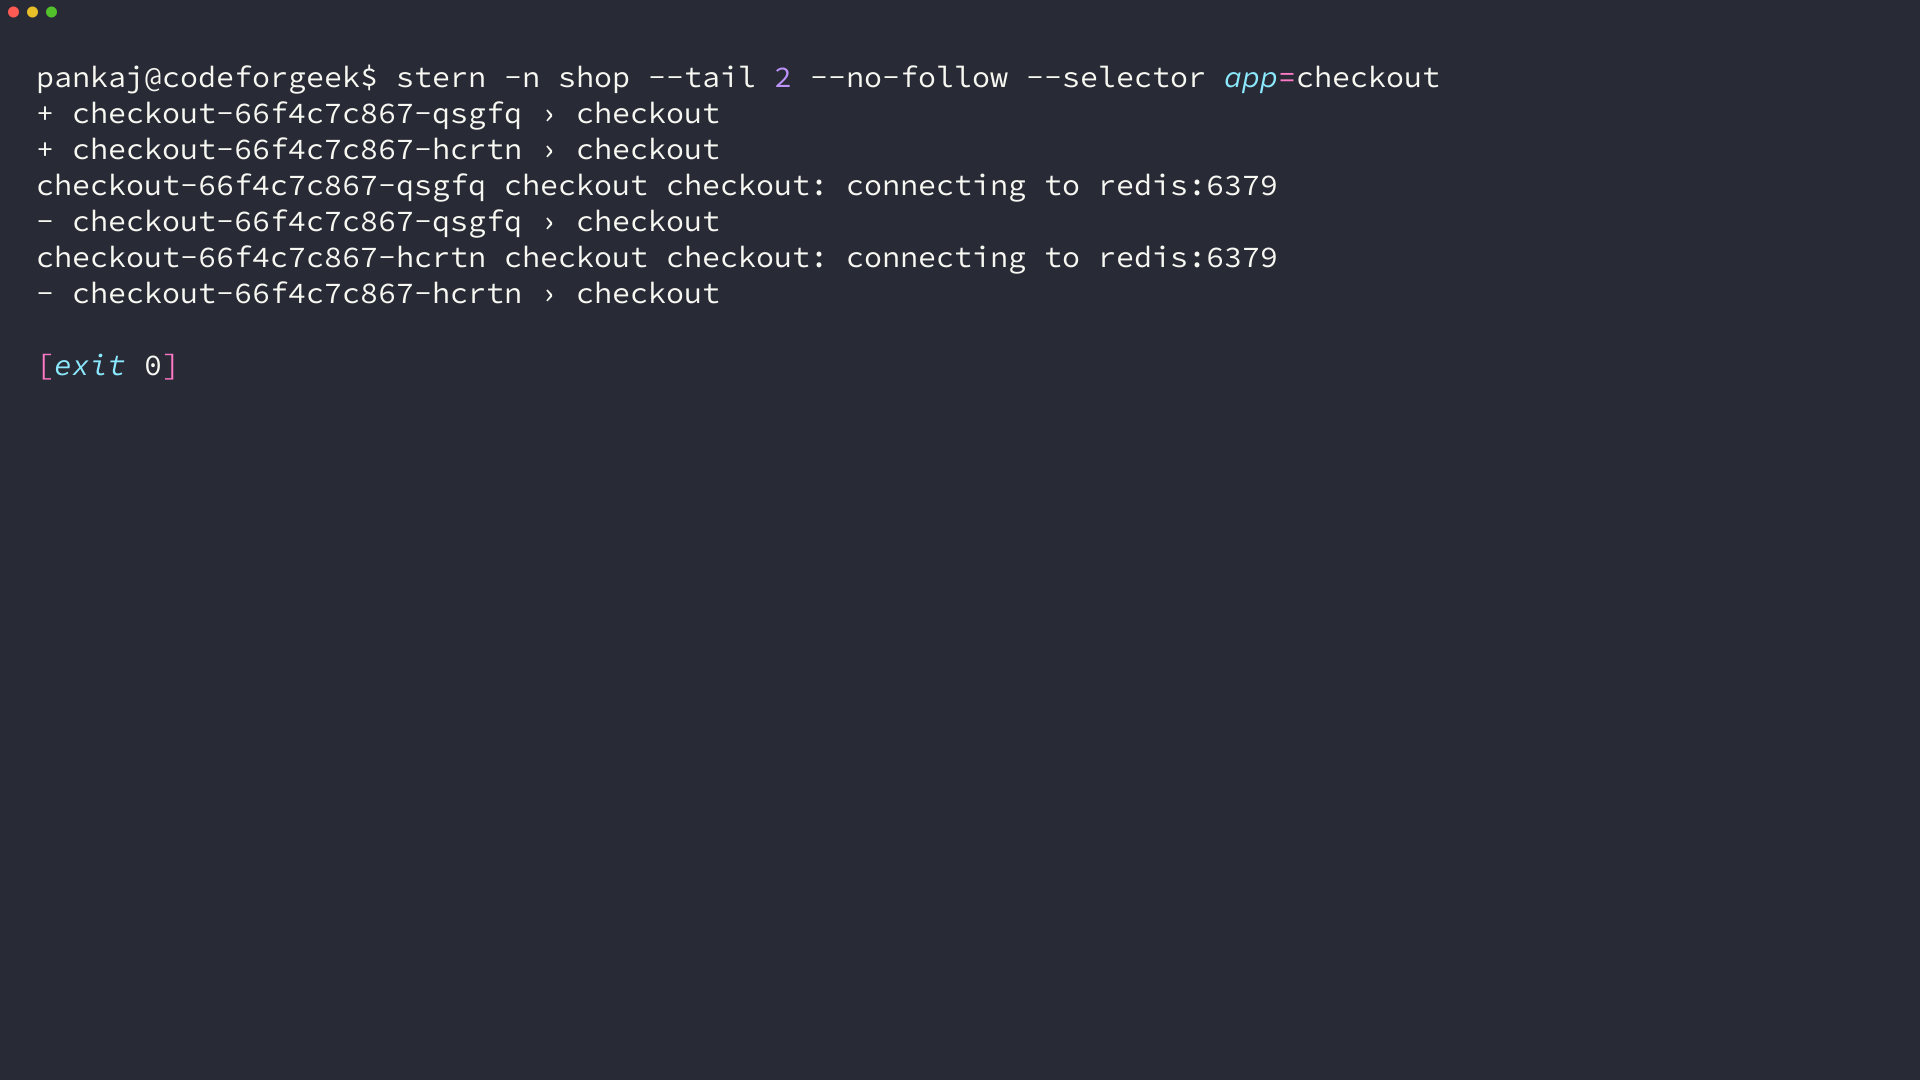
I pointed it at two pods that restart every few seconds, and both streams arrived in one output. Selector matching is the reason to use it over a loop across pod names, since the same selector that defines a deployment defines its log set.
Browse the cluster in a terminal
k9s is a terminal interface over the same API, and its value during an incident is speed rather than new information.
k9s version
[36m ____ __ ________ [0m
[36m| |/ / __ \______[0m
[36m| /\____ / ___/[0m
[36m| \ \ / /\___ \[0m
[36m|____|\__ \/____//____ /[0m
[36m \/ \/ [0m
[36mVersion:[0m v0.51.0
[36mCommit:[0m 558caafe7ba067467de46b320cc22ef11fef9c34
[36mDate:[0m 2026-06-06T14:04:25Z
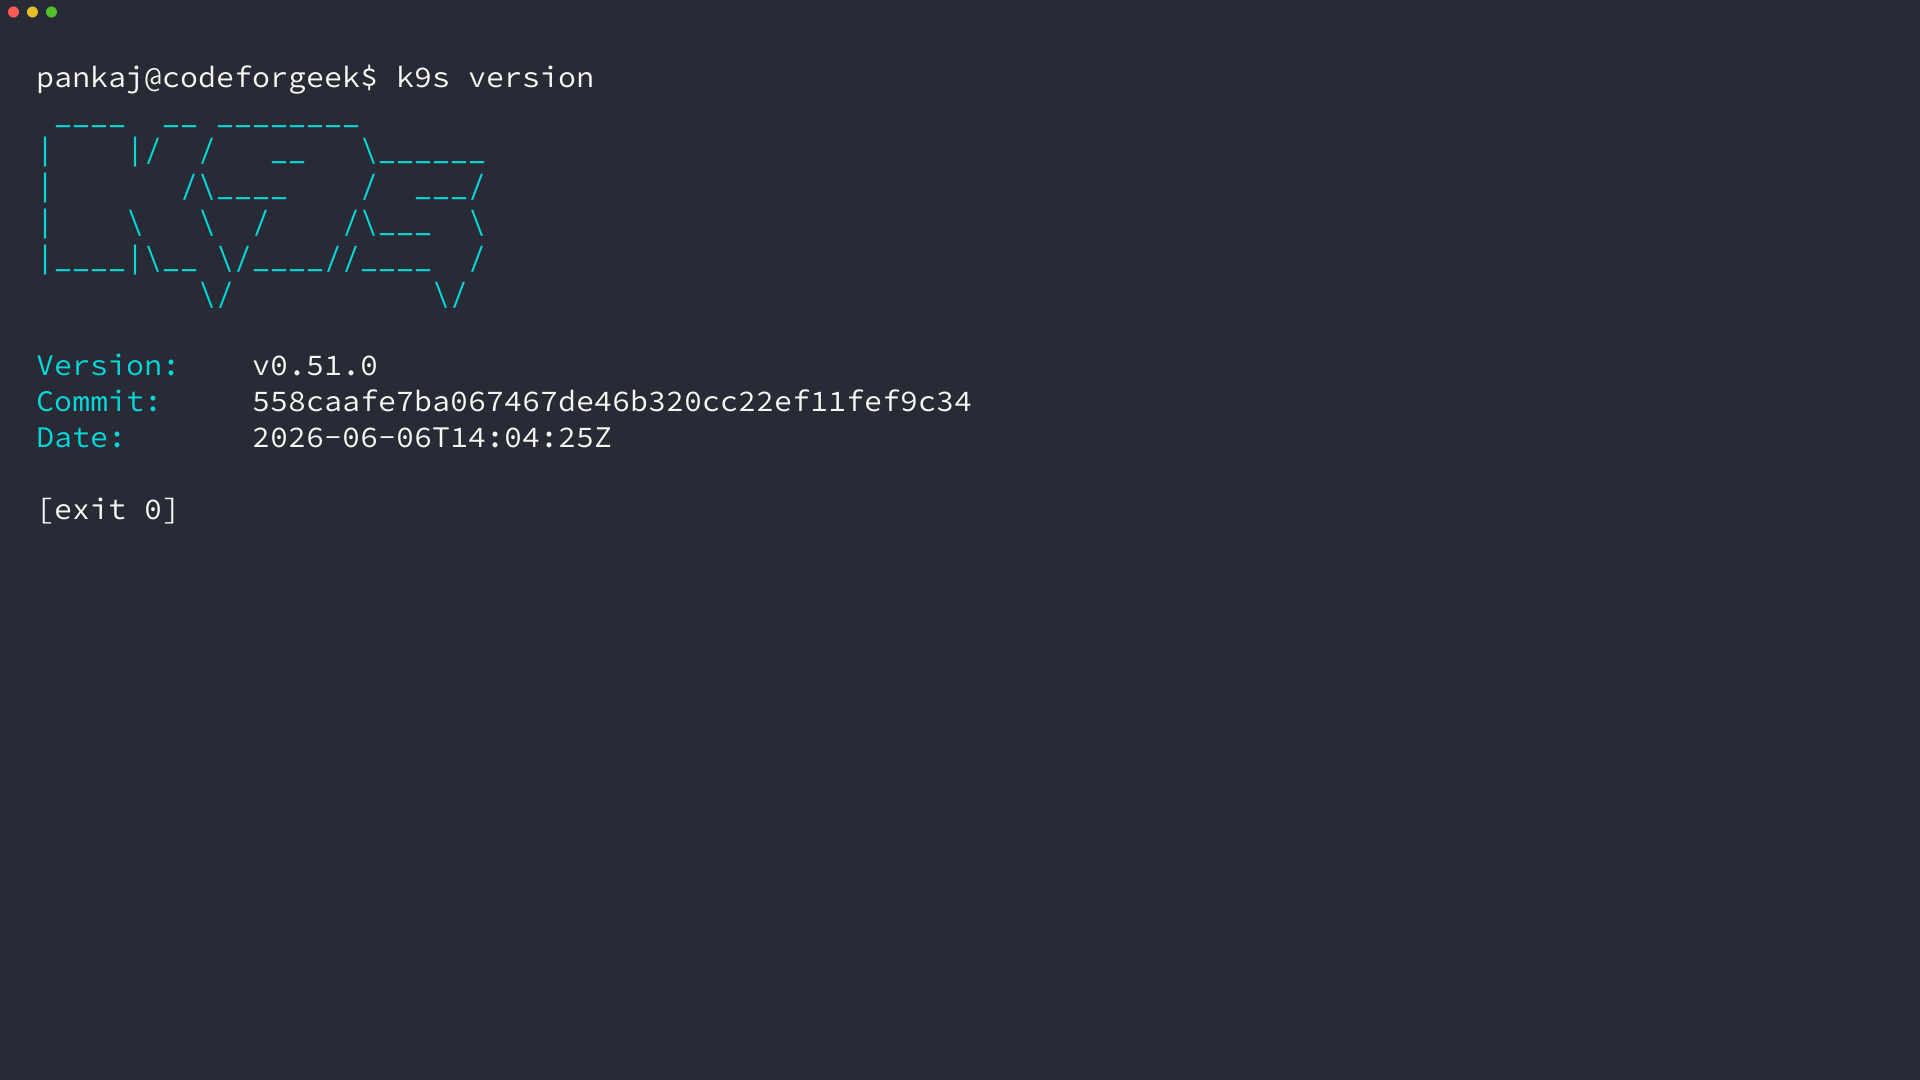
A terminal interface assumes a person at a keyboard, so it earns its place on a workstation rather than in a script. Resource views, port forwards and log tails are the three jobs it shortens.
Get numbers for the container eating memory
kubectl top is part of the client, but it reads the metrics API rather than the pod objects, so a cluster with no metrics source answers with an error.
kubectl top pods -n shop
error: Metrics API not available
metrics-server is the component that supplies it. On a kind cluster it needs one extra argument, because the kubelet certificate it scrapes is not signed for the node address.
curl -sSLo metrics-server.yaml https://github.com/kubernetes-sigs/metrics-server/releases/latest/download/components.yaml
kubectl apply -f metrics-server.yaml
kubectl -n kube-system patch deployment metrics-server --type=json \
  -p '[{"op":"add","path":"/spec/template/spec/containers/0/args/-","value":"--kubelet-insecure-tls"}]'
I installed it on this cluster and the same command that failed a minute earlier started returning numbers. The latest download resolves to version v0.9.0.
kubectl top nodes
NAME                CPU(cores)   CPU(%)   MEMORY(bytes)   MEMORY(%)
cfg-control-plane   173m         8%       725Mi           9%
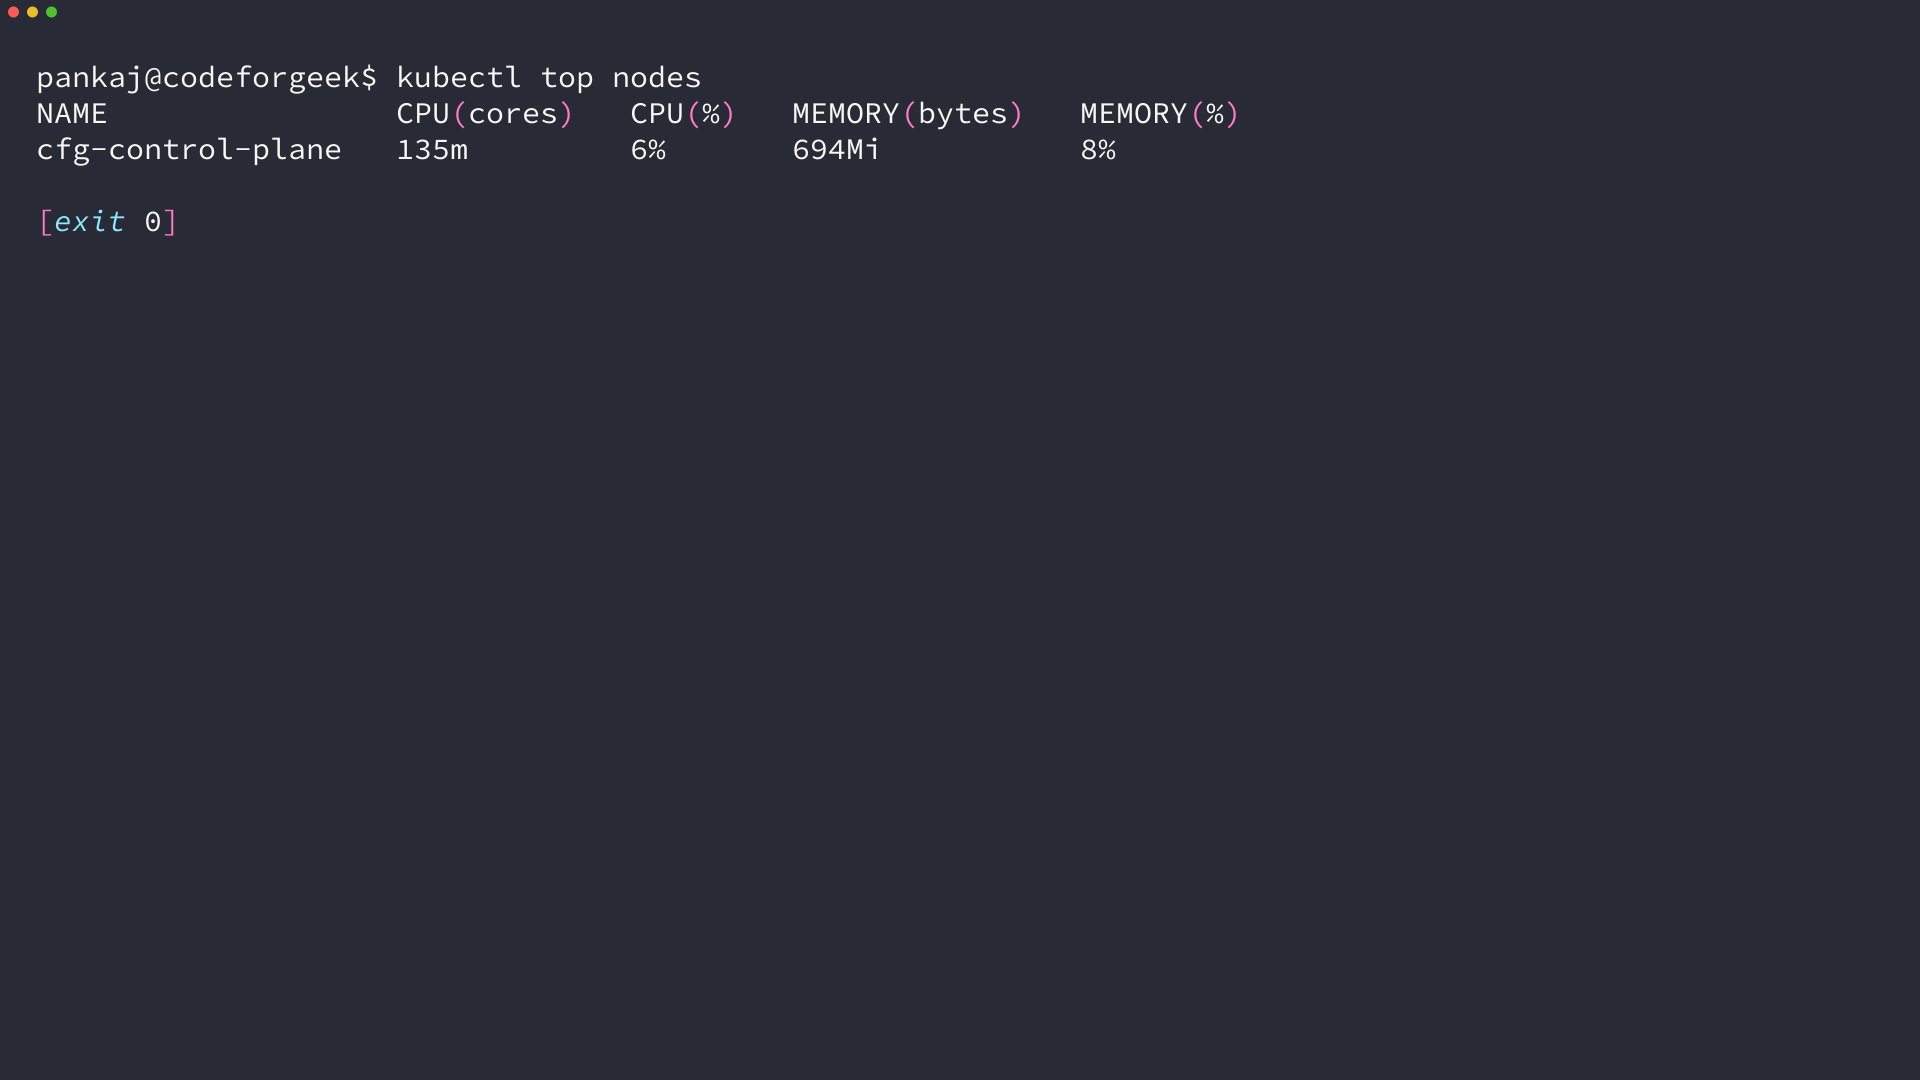
The metrics path carries its own boundaries. A pod younger than the first scrape returns Metrics not available for that pod together with its age, because a Pending pod has no metrics to report at all.
Scan for what has not broken yet
popeye reads cluster objects and grades them against a set of checks, which is a different job from reading one failure. It scored this namespace and reported three things about the same broken deployment.
popeye -n shop -s deploy
DEPLOYMENTS (2 SCANNED)                                                        💥 1 😱 1 🔊 0 ✅ 0 0٪
  · shop/checkout..................................................................................💥
    💥 [POP-501] Unhealthy 2 desired but have 0 available.
    🐳 checkout
      😱 [POP-101] Image tagged "latest" in use.
      😱 [POP-106] No resources requests/limits defined.
  · shop/demo-release..............................................................................😱
    🐳 demo-release
      😱 [POP-106] No resources requests/limits defined.
SUMMARY
Your cluster score: F (0)
None of those three findings appear in the crash loop output, and the floating tag and the missing resource requests are the kind of problem worth reporting before an incident rather than during one.
Roll back the release instead of diagnosing it
Helm appears on every list of Kubernetes tools because it deploys things, and its use during an incident is the release history. I installed a release on this cluster to see what that history holds.
helm history demo-release -n shop
REVISION	UPDATED                 	STATUS  	CHART             	APP VERSION	DESCRIPTION
1       	Wed Sep 16 14:20:25 2026	deployed	demo-release-0.1.0	1.16.0     	Install complete
An upgrade adds a revision, and the rollback puts the older chart back without a diagnosis.
helm upgrade demo-release ./demo-release -n shop --set replicaCount=2
helm rollback demo-release 1 -n shop
helm history demo-release -n shop
Rollback was a success! Happy Helming!
REVISION	UPDATED                 	STATUS    	CHART             	APP VERSION	DESCRIPTION
1       	Wed Sep 16 14:20:25 2026	superseded	demo-release-0.1.0	1.16.0     	Install complete
2       	Wed Sep 16 14:20:26 2026	superseded	demo-release-0.1.0	1.16.0     	Upgrade complete
3       	Wed Sep 16 14:20:27 2026	deployed  	demo-release-0.1.0	1.16.0     	Rollback to 1
The version that ran here is v4.3.0 from September 2026, so Helm 4 is the release family to install rather than Helm 3.
Tool lists go stale quickly. Kubewatch still turns up in recommendations, and its repository is archived with the last release in 2020. Gitkube has shipped nothing since April 2020, so neither belongs in a list you hand to a team today.
Checking the releases API before recommending a tool costs seconds and saves the reader a dead end.
Keep a timeline of what changed
The commands above tell you what the cluster is doing now, and nothing about what changed an hour ago. That second half is where many incidents get solved.
Prometheus stores time series and answers questions in PromQL, and the kube-prometheus operator bundle at v0.18.0 deploys it with Kubernetes dashboards and alerting rules. kube-state-metrics at v2.20.0 adds the object-level series that describe deployment and replica state rather than resource use.
The commercial option is a timeline product more than a dashboard. Komodor’s current positioning is an agentic operations platform for production, and what helps during an incident is the change history it assembles across deployments, configuration and infrastructure.
Headlamp, the Kubernetes SIG web interface at v0.45.0, covers the browse-the-cluster job for anyone who would rather not learn a terminal interface.
What each command does not cover
Every path above has a boundary that turns a one minute command into a blocked one, and knowing them in advance is the difference between escalating and flailing.
- The metrics API is absent on a fresh cluster, so kubectl top fails until a metrics source exists.
- Previous container output lives in the runtime’s log store and is removed with the container, so crash loop evidence can vanish between attempts.
- An ephemeral container needs a target container that is still running, plus the pods/ephemeralcontainers verb.
- A node debug pod needs a long-running command, and a non-root process cannot reach the host root without extra capabilities.
- A dead kubelet writes no events at all, so a NotReady node has nothing to read until you reach the node itself.
- Locked-down clusters refuse exec, debug containers and node pods by policy, and no flag changes that.
Some of those boundaries are permissions rather than technical limits, so confirm your own verbs before planning a path the cluster will refuse.
Read the events before you install anything
The built-in commands turn a red pod into a cause, and the tools that follow read the same evidence at a scale a person cannot. That makes the order fixed: describe the object, read the events, read the container output, and install something only when a question survives all three.
Start with the events for the namespace, sorted so the newest change sits at the bottom.
kubectl get events -n shop --sort-by=.lastTimestamp
Everything after that follows the evidence, which is the only sequence that keeps a tool from becoming the thing you are debugging.
FAQ
How do I troubleshoot a Kubernetes pod that keeps restarting?
Read the last exit code from the pod’s container status first, then the Warning events for that pod, then the container output. Exit 1 points at the application, exit 137 at an enforced memory limit, and 143 at a shutdown signal.
Why does kubectl logs –previous sometimes say there are no logs?
Previous output comes from the container runtime’s log store, and the runtime removes it along with the dead container. The exit code and the event reason stay on the pod object, so read those first and treat the log as a bonus.
Does kubectl top work without metrics-server?
No. kubectl top reads the metrics API rather than the pod objects, and a cluster with no metrics source answers with Metrics API not available. metrics-server is the component that provides that API.
Is kubectl debug safe to run in production?
The command adds a container to a running pod and shares the target’s namespaces without restarting it. The permission it needs, pods/ephemeralcontainers, is the control worth reviewing, because any process you start there runs with the pod’s access.