New to Rust? Grab our free Rust for Beginners eBook Get it free →
Pandas dataframe.groupby() Method: A Detailed Guide

The groupby() method in the Pandas library is a powerful and flexible tool for grouping data based on one or more criteria and then for applying a method to each group independently. It is also a fundamental tool for data analysis and manipulation in Pandas, enabling efficient and flexible operations on grouped data. It plays a crucial role in various stages of the data analysis workflow, from exploring and summarizing data to more complex tasks involving grouping and aggregation.
Also Read: Get Unique Values from Columns in Pandas DataFrame
Syntax of Pandas groupby() Method
Pandas groupby() method is a key feature for performing split-apply-combine operations on DataFrames. One can understand the workings of the Pandas groupby() method through its syntax which is given below. It contains all the basic constituents required for its effective functioning.
Syntax:
DataFrame.groupby(by=None, axis=0, level=None, as_index=True, sort=True, group_keys=True, squeeze=False, observed=False)
Parameters:
- by (mapping, function, label, or list): Specifies the criteria for grouping. It can be a column name, a function, or a list of criteria.
- axis (int, default 0): Specifies whether to group along rows (0) or columns (1).
- level (int, level name, or sequence of such, default None): For DataFrames with multi-level index, this parameter specifies the level to use for grouping.
- as_index (bool, default True): If True, the group labels will be used as the index in the result.
- sort (bool, default True): Specifies whether to sort the resulting groups by group labels.
- group_keys (bool, default True): If True, add group keys to the index to identify each original index.
- squeeze (bool, default False): If the grouped data is a single group, return the data as a Series.
- observed (bool, default False): This parameter is used when the grouping information is categorical. If True, only show observed values for categorical groupers.
Implementation of Pandas groupby() Method
After knowing the syntax and the parameters of the groupby() method, let’s move on to implementing it. For implementing groupby() method let’s first create a DataFrame.
import pandas as pd
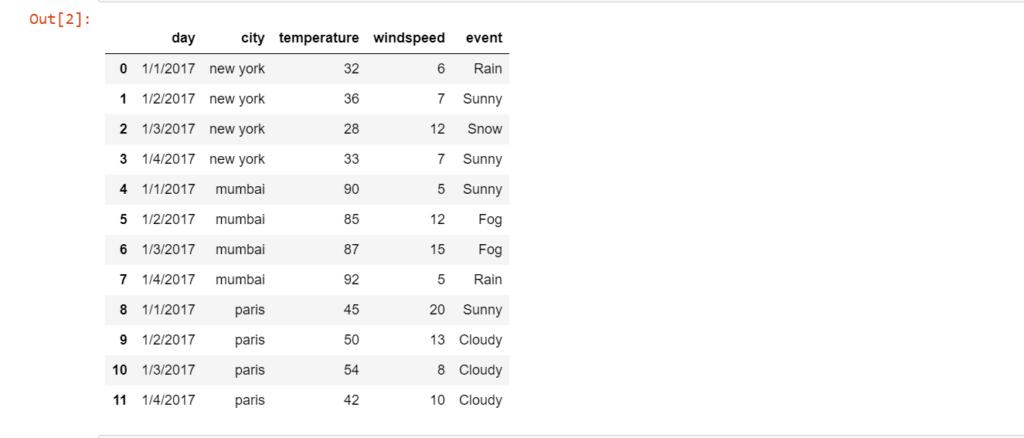
df = pd.read_csv("weather_by_cities.csv")
df
Here we first imported the Pandas as pd, then created the DataFrame using a CSV file, the CSV file name is weather_by_cities.csv, and then printed the DataFrame.
Output:
Let’s see how to use groupby() method in different scenarios on the above-created DataFrame.
Using Pandas groupby() with Single Column
As we know the pandas groupby() method is used to split and segregate some parts of data from the DataFrame by passing specific conditions into it. So here we will be grouping the DataFrame by passing a single column into it.
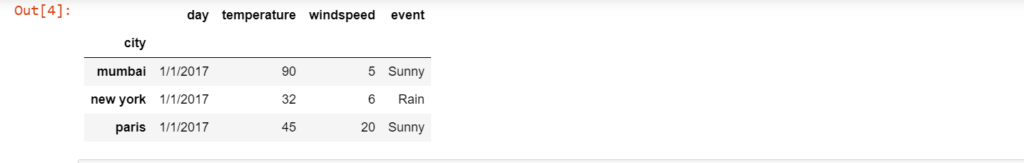
g = df.groupby('city')
g.first()
Here we have passed ‘city’ column inside the groupby() method which splits our original DataFrame ‘df’ and created a new DataFrame where all the data belongs to the ‘city’ column.
Output:
Using Pandas groupby() with Multiple Columns
In this section, the only difference with the last section is that instead of grouping our data based on a single column, we will pass more than one column.
g = df.groupby(['city','event'])
g.first()
Output:

Selecting Group Using get_group() Method
Apart from splitting the data based on a specific column, we can also access a specific group from the DataFrame by using the get_group() method.
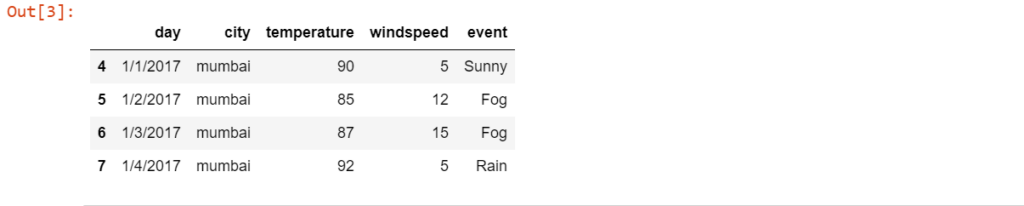
g = df.groupby('city')
g.get_group('mumbai')
Here we first grouped the data based on the ‘city’ column and saved the resultant DataFrame in variable g. Then we have written g.get_group(‘mumbai’) which helps us to access the data belonging to the mumbai in the DataFrame g.
Output:
Analyzing Group Using describe() Method
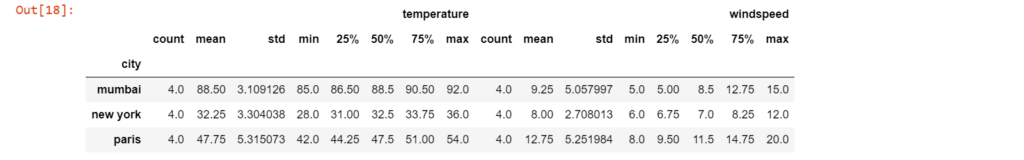
The describe() method will give us various statistics like mean, count, standard deviation, etc.
g = df.groupby('city')
g.describe()
Output:
Plotting Graphs for Group Using plot() Method
Let’s plot some graphs, for this, we will first write %matplotlib inline which helps the Python environment to draw the plots immediately after the current cell. After that, we will use the plot() method for plotting graphs.
g = df.groupby('city')
%matplotlib inline
g.plot()
Output:
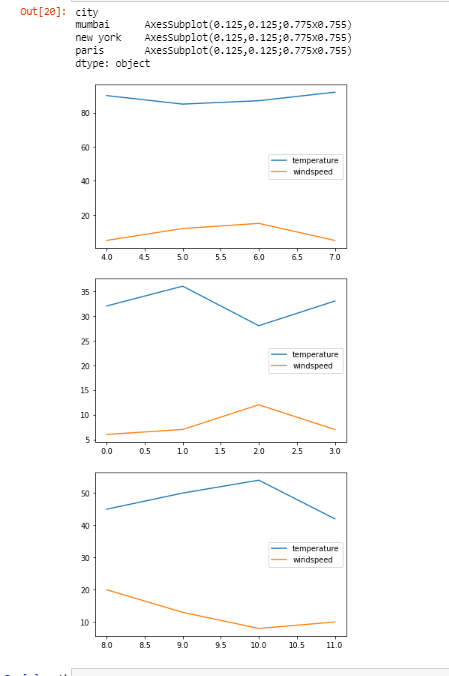
After calling the plot() method, we got three different plots that correspond to the temperature and windspeed in each of the cities. The first plot is for ‘mumbai’, the second is for ‘new york’ and the third is for ‘paris’.
Summary
Pandas groupby() method is a versatile tool for performing group-based operations on DataFrames. In this tutorial, we have discussed how to use it with single and multiple columns. Then we learned how to select groups, analyse groups and plot graphs with groupby() method. After reading this tutorial, we hope you can easily group data in Python.
Reference
https://pandas.pydata.org/docs/reference/api/pandas.DataFrame.groupby.html