New to Rust? Grab our free Rust for Beginners eBook Get it free →
8 Application Performance Monitoring Tools to Consider in 2023
Introduction
In today’s fast-paced digital landscape, it is very important for applications to be performant.
The smooth and efficient operation of their software is essential for businesses to deliver a top-notch user experience. Applications moving to the cloud enable businesses to collect a lot of data from across devices. Analyzing this data can streamline business and ensure better user satisfaction, leading to better outcomes.
Application Performance Monitoring (APM) tools have become indispensable for modern businesses, helping them monitor, analyze, and optimize their applications. In this article, we’ll see what factors you should keep in mind before choosing an APM tool. We will look at the top eight powerful APM tools that you should consider in 2023 to keep your applications running at their best.
Choosing an APM tool
Considering your specific needs and requirements is crucial when selecting an APM tool. Consider factors such as:
- What features hold significance for you? Do you need an APM tool with a strong focus on error tracking, observability, or DevOps?
- How scalable is the APM tool? Can it handle the volume of data that your applications generate?
- What is the pricing model for the APM tool? Does it fit your budget?
- What level of support does the APM tool vendor offer? Is it available 24/7?
It is important to peruse reviews from fellow users and conduct comparisons of features and pricing. You may also want to try out a few different APM tools before making a decision. Below, you’ll find 8 top APM tools to aid you in making the best choice for your organization:
groundcover
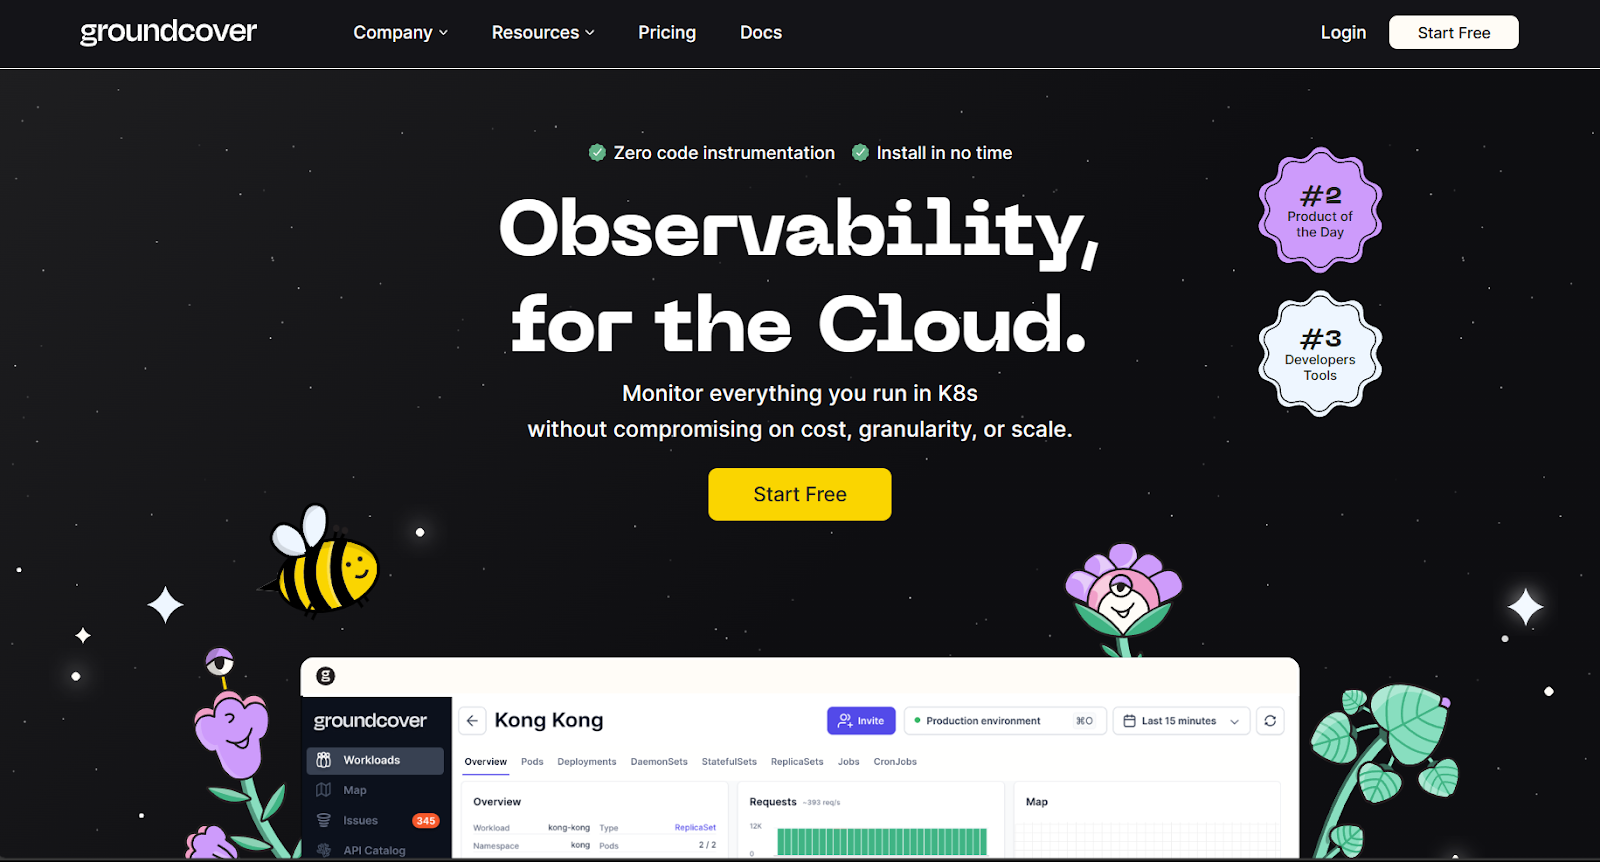
groundcover is an APM solution that delivers instant insights into your application. groundcover comes with a user-friendly interface and customizable dashboards that make it easy to visualize performance metrics, trace transactions, and pinpoint bottlenecks. Its automated alerting system ensures that you’re notified of anomalies promptly. You can automatically detect and resolve issues across your entire cluster with groundcover. It offers transparent pricing per node, enabling you to cover everything at a fraction of the cost. Data remains private, secure, and under your control within your cluster with the help of groundcover’s unique in-cluster architecture.
You can also make monitoring easier by easily sending traces and logs from anywhere to groundcover’s cloud-based system using supported protocols like OpenTelemetry or Prometheus. To try groundcover, you can log in to use the free trial without a credit card. groundcover makes it very easy to connect your clusters. Once Kubectl is installed, all you have to do is copy a script and run it in your cloud shell or terminal. groundCover supports a wide range of technologies, making it a versatile choice for APM.
Dynatrace
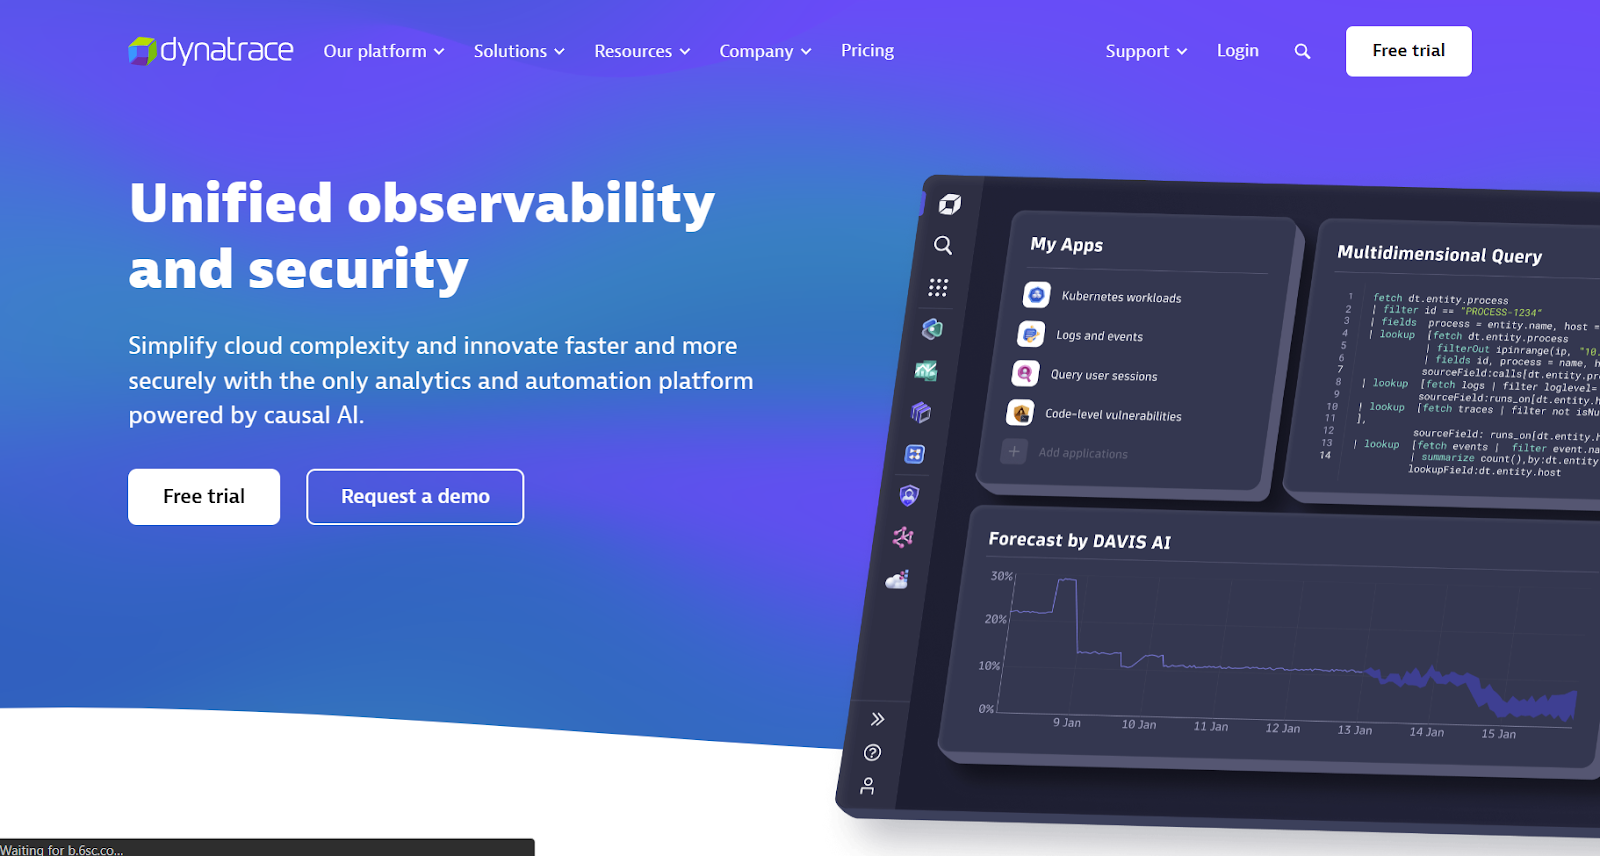
Dynatrace stands out as an AI-powered APM tool known for its exceptional full-stack monitoring capabilities. It automatically discovers and maps your application’s dependencies, providing a comprehensive view of your entire ecosystem. Dynatrace’s AI engine, Davis, detects anomalies, allowing you to resolve issues faster. It offers real user monitoring, code-level insights, and deep visibility into microservices. Dynatrace is a robust solution for organizations looking to gain a deep understanding of their application’s performance.
Dynatrace’s trial doesn’t require a credit card, you can use your business email ID to log in. It comes with a whole variety of dashboards. You can clone these dashboards, add your data sources, and get useful metrics. They have tiles that are configurable in the data explorer, where you can run customized queries. Dynatrace’s AWS monitoring utilizes AI to automatically detect business impacts, identify problems, and perform root cause analysis for all AWS services. Dynatrace has a wide range of integrations you can choose from including Amazon, GCP, and Azure, making it easy to source and monitor data.
Datadog
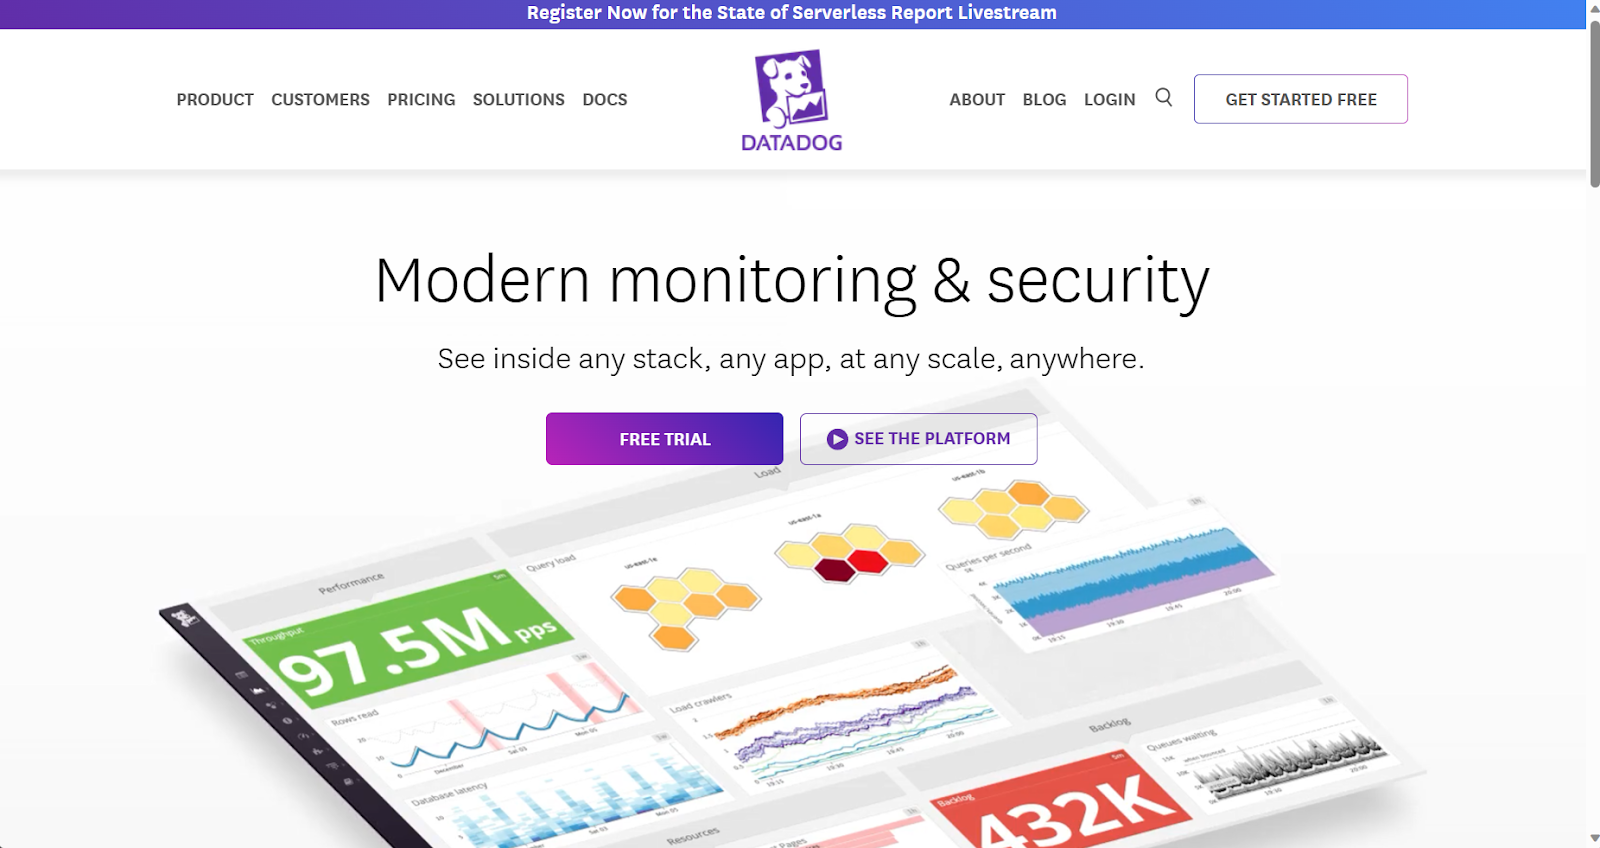
Datadog is a popular and widely used APM tool known for delivering real-time insights into application performance, infrastructure, and logs. It is a good choice for organizations of all sizes and is particularly well-suited for organizations that are already using Datadog for other monitoring tasks.
Datadog comes with AI-powered anomaly detection and actionable customized alerts. You can analyze millions of network flows and address global security threats in real-time. This allows businesses to resolve issues at lightning-fast speed. It also supports a lot of integrations.
New Relic
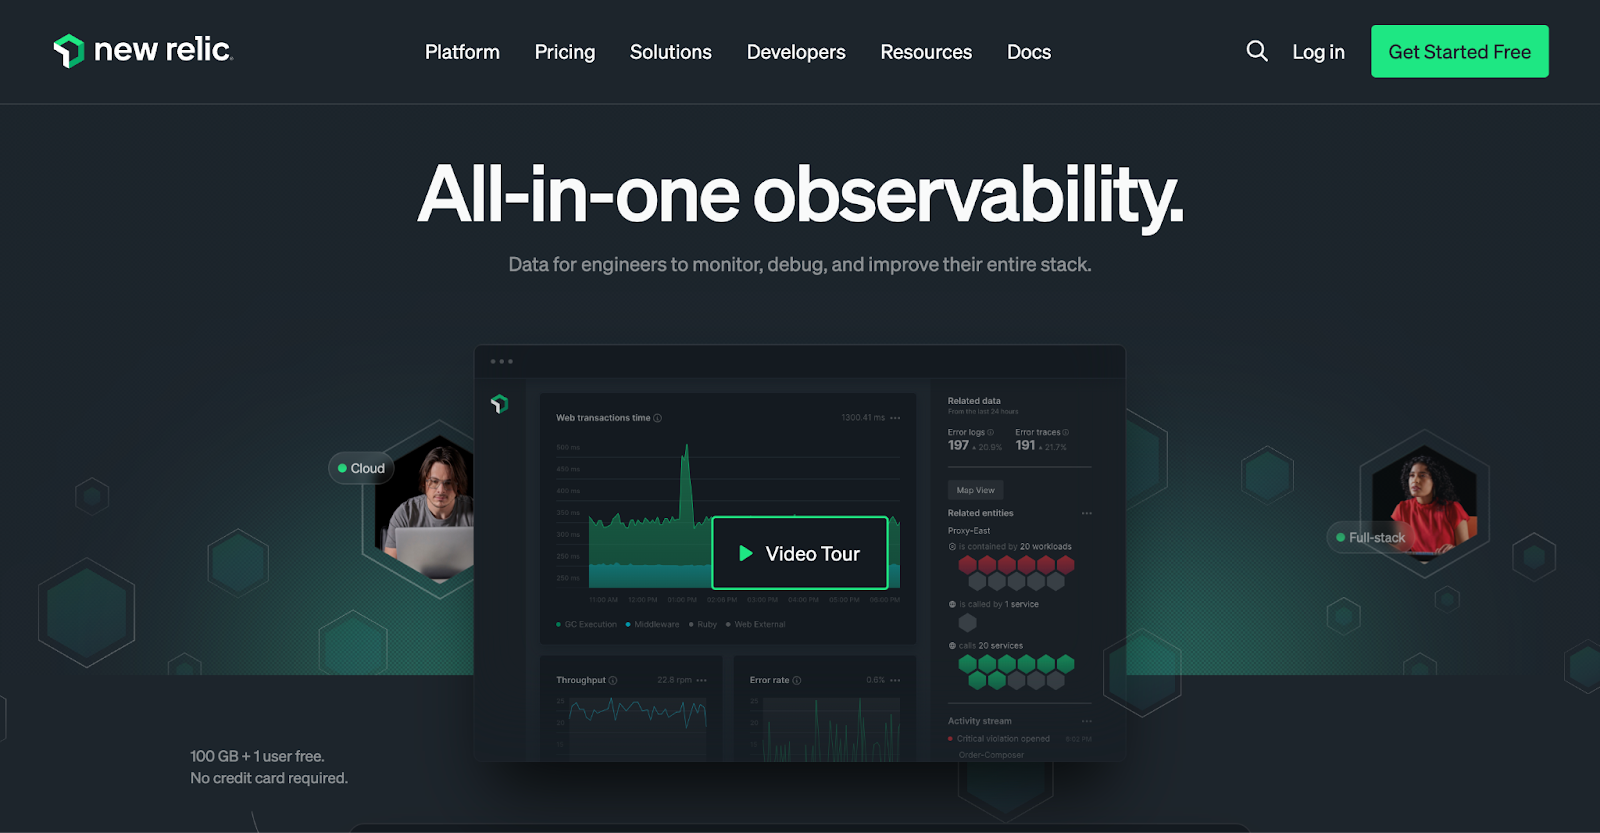
New Relic is a cloud-based APM platform known for its user-friendly interface and broad application support. It provides real-time monitoring, alerting, and detailed performance analytics. With New Relic, you can gain insights into application response times, errors, and resource utilization. It also offers end-to-end transaction tracing and deep code-level visibility. New Relic’s scalability and customizable dashboards suit businesses of all sizes. To try New Relic, you need to sign up with your company email. When you sign up initially, you get a prompt to select a stack for various tasks for application monitoring e.g. python, go, node, js, PHP, etc.
Whether it’s in the cloud or on-premise, you can monitor your data using New Relic’s cloud-based platform. New Relic allows you to connect and correlate issues throughout your entire stack. You can debug and collaborate directly from your IDE, and benefit from AI assistance at every stage. You can access dashboards, alerts, and integrations in a single location with New Relic’s Instant Observability quickstarts. These bundles provide you with everything necessary to begin monitoring like an expert right from the start.
AppDynamics
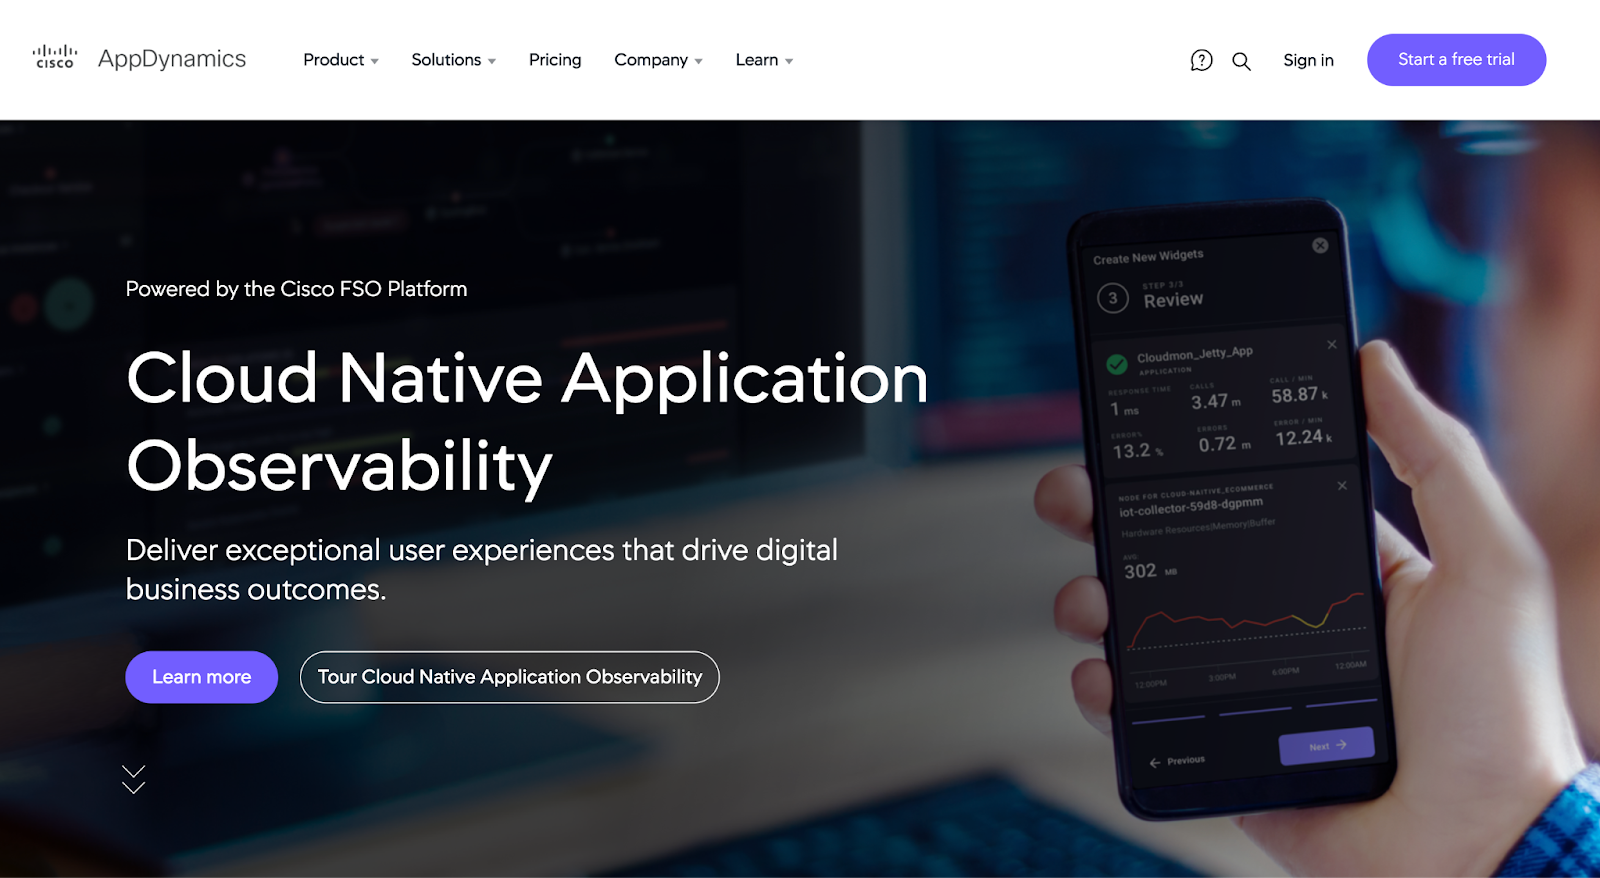
AppDynamics is an APM tool designed for businesses with complex, distributed architectures. It offers real-time performance monitoring, code-level diagnostics, and business transaction tracking. AppDynamics automatically baselines your application’s performance and sends alerts when deviations occur. Its end-to-end visibility allows you to identify issues across your entire stack, from the user interface to the backend services. AppDynamics also provides valuable insights into user journeys and business impact.
Additionally, you gain enterprise-grade visibility for monitoring cloud-native technologies in real-time and achieve complete infrastructure visibility, covering servers, networks, and containers, whether they are on-premises or in the cloud, ensuring you have everything you need for a seamless monitoring experience.
Sentry
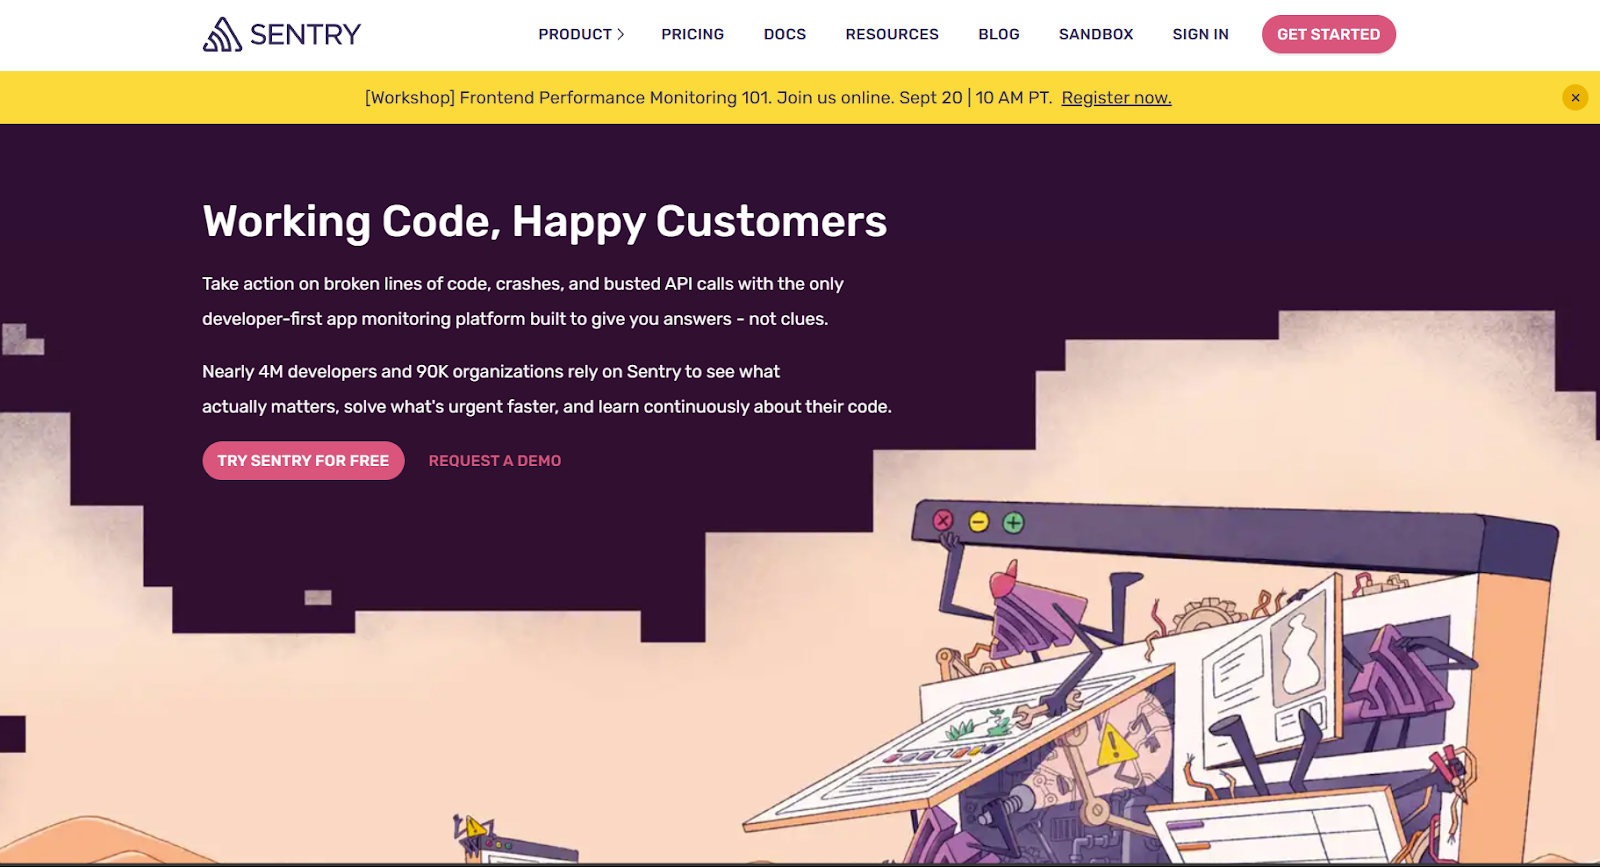
Sentry is an APM tool with a primary focus on error detection and system monitoring. It provides real-time visibility into application errors and can be used to troubleshoot and diagnose problems quickly and easily. With Sentry, you can see the issues that truly matter across all platforms, ensuring that no bug slips through the cracks without you noticing. When issues do arise, you can solve them using deep context that eliminates the need for back-and-forth issue resolution across teams.
Sentry helps you learn valuable insights to enhance your projects, teams, and organization. You’ll discover patterns and irregularities, providing you with the insights necessary for continuous improvement. It also lets you dive deep into error and latency issues with visual replays that include crucial contexts like DOM events, console logs, and network calls. As a result, you can identify the underlying issue more quickly, which ultimately saves you both time and valuable resources.
Instana
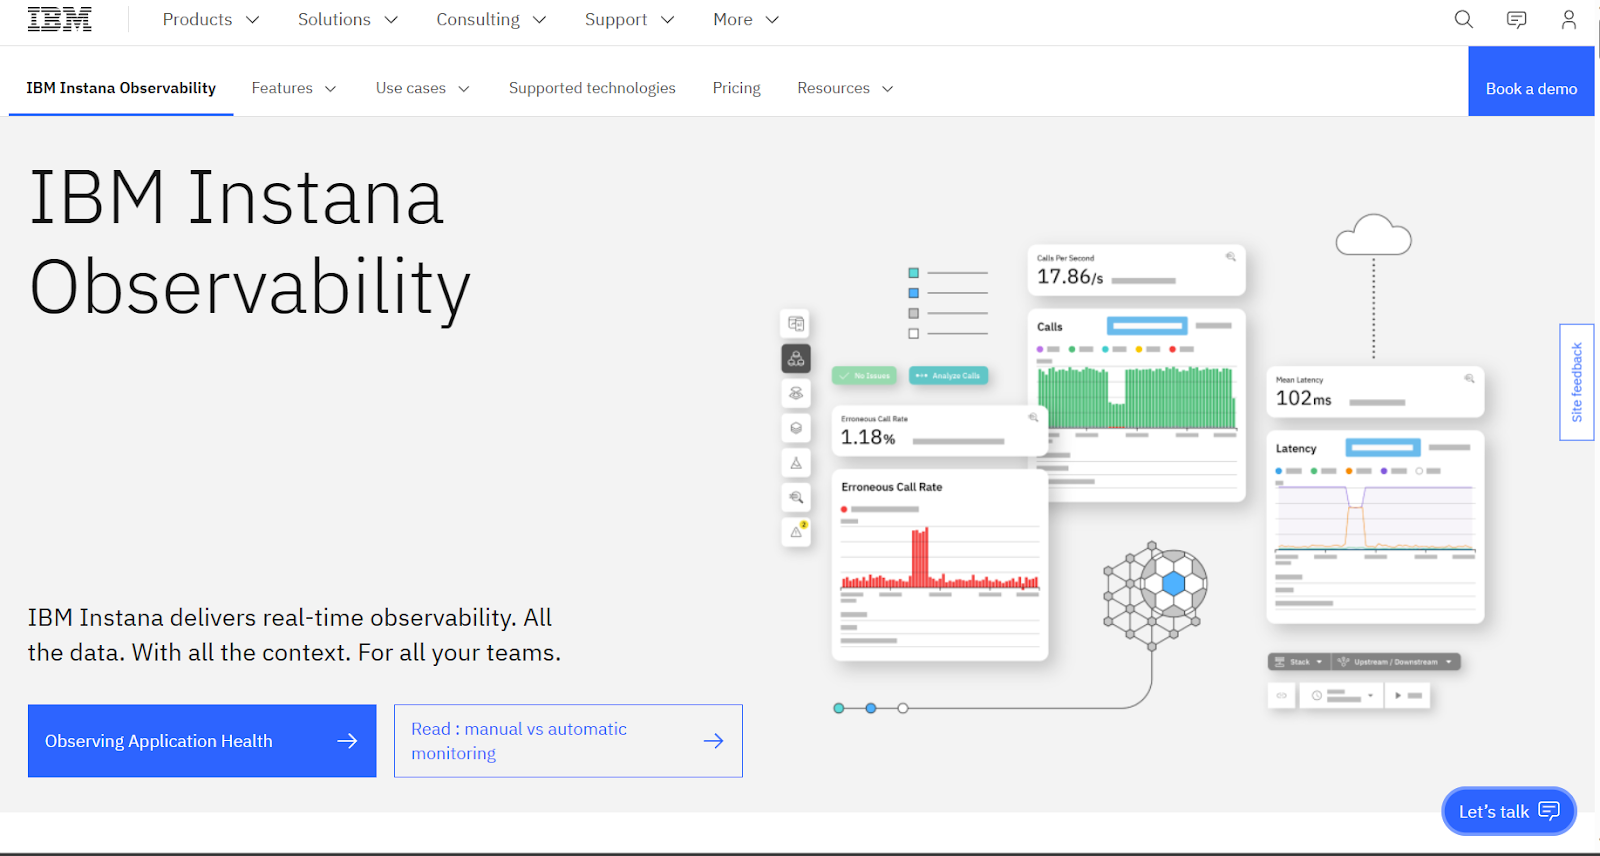
Instana is an APM tool that focuses on observability and swift remediation of alerts. It provides you with complete observability using just one lightweight agent per host. You’ll continuously monitor all aspects of your application in real-time, from performance to microservices, databases, and containers, without any sampling. Actionable insights and automation make issue resolution fast and efficient.
Instana automatically maps services, collects metrics, traces requests and identifies application dependencies. It even catches and isolates errors in your browser and mobile apps, including JavaScript issues. You can remediate these issues swiftly with Instana’s smart alerts, automatic event detection, and quick identification of root causes, ensuring the fastest mean time to resolution (MTTR). You can also optimize the digital experience with unified data from mobile app and website monitoring, gaining valuable insights into user behavior and promptly resolving frontend issues.
Stackify Retrace
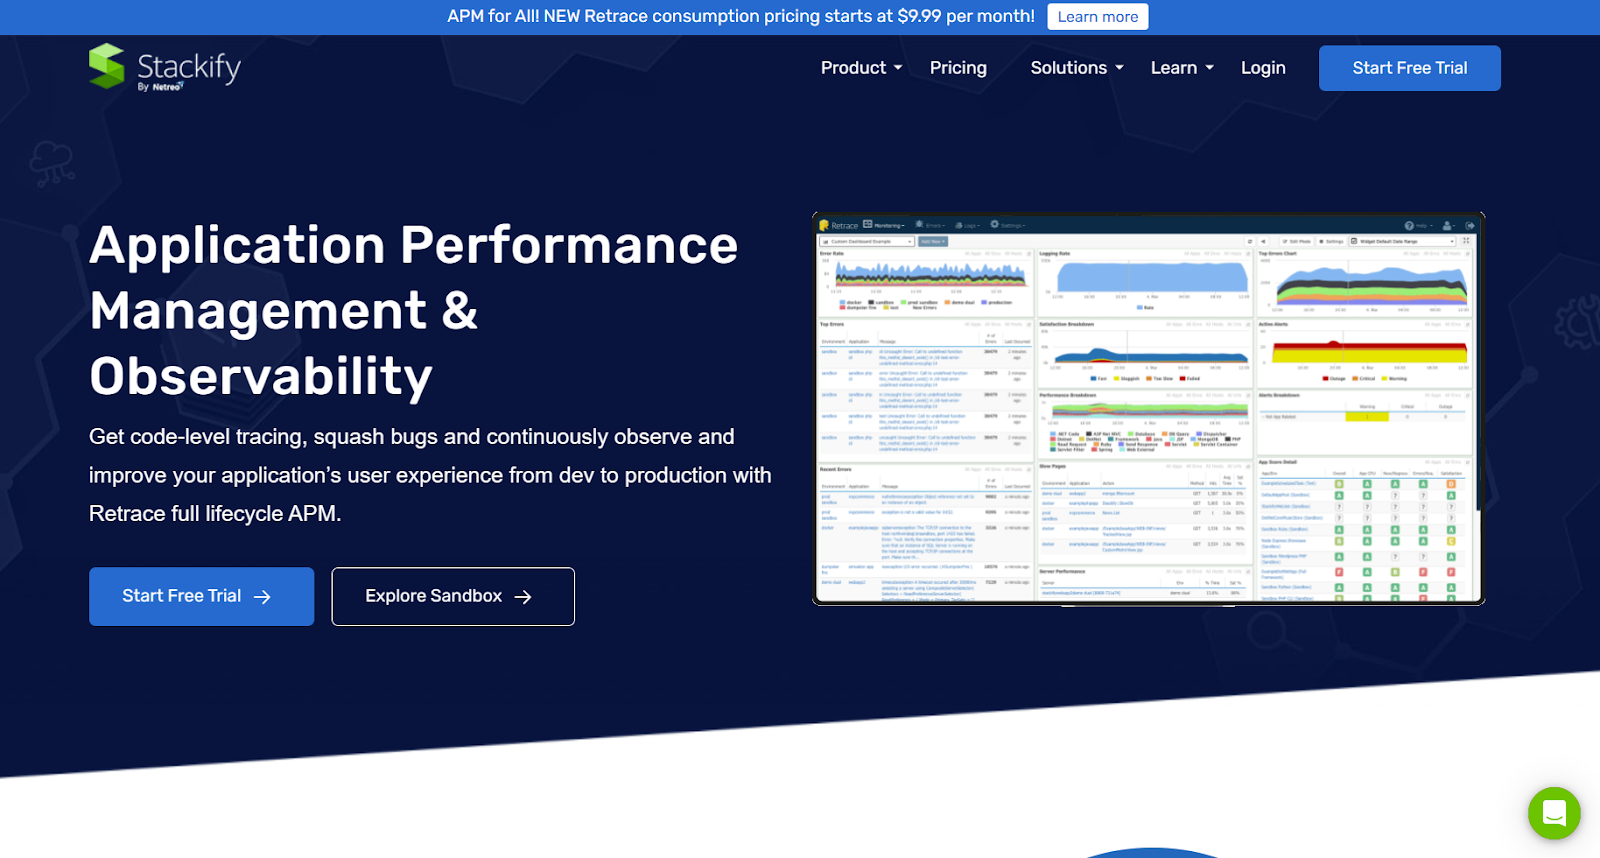
Stackify Retrace is an APM tool designed for developers. Retrace helps developers optimize their code by providing insights into application performance bottlenecks and exceptions. Stackify Retrace is an ideal choice for organizations looking to empower their development teams with APM capabilities.
With Stackify Retrace, you can increase efficiency by centralizing logs, making troubleshooting easier with aggregated application and server logs, and advanced search and drill-down capabilities. Retrace provides integrated Application Performance Monitoring to continuously improve user satisfaction. It enables you to collect essential metrics across your complete technology stack for each monitored application’s entire lifespan. This allows you to take advantage of vital metric tracking with built-in alerts, and personalized metrics utilizing custom dashboards.
Conclusion
In 2023, it is evident that application performance continues to play a pivotal role in ensuring an exceptional user experience. These eight APM tools offer diverse features to help you monitor, analyze, and optimize your applications effectively. Whether you need full-stack visibility, code-level diagnostics, network performance analysis, or error tracking, there’s an APM tool on this list to meet your requirements. Embrace the power of APM to ensure your applications perform at their best and keep your users happy.