New to Rust? Grab our free Rust for Beginners eBook Get it free →
Application Performance Monitoring in Kubernetes: Best Practices and Tools
Kubernetes is a freely available system created to streamline the process of deploying, expanding, and overseeing applications that are built with containers. These containers are compact, movable elements that bundle the code and the necessary dependencies, simplifying the execution of applications in various settings.
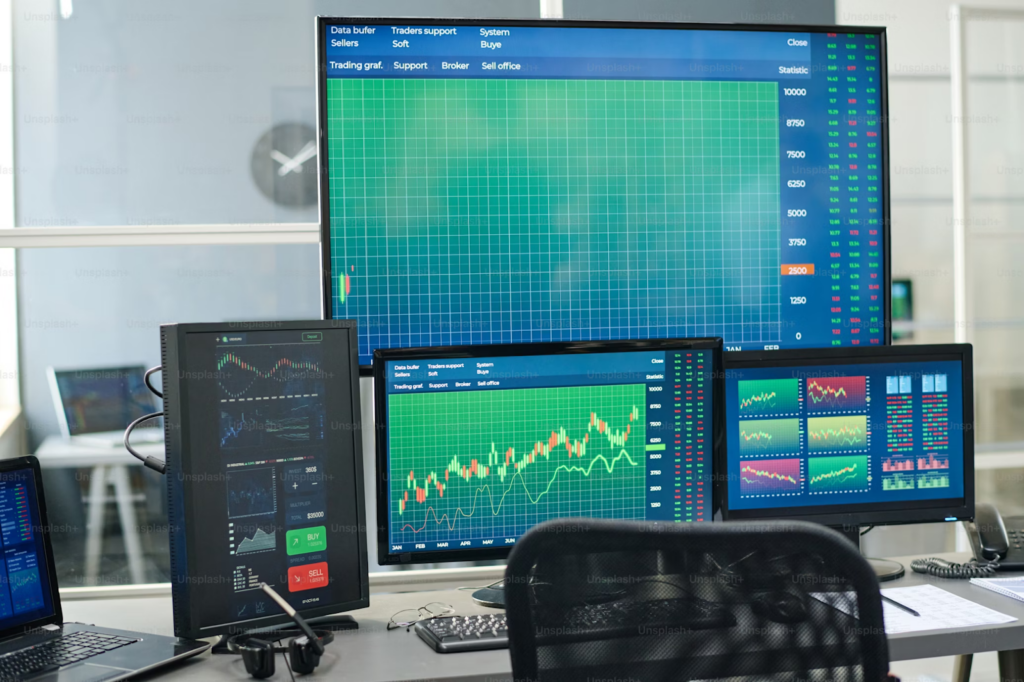
APM is about observing the efficiency and accessibility of applications. Within a Kubernetes setup, this means keeping an eye on the efficiency of containers, pods, and the entire cluster to verify that all components are working properly.
Best Practices for APM in Kubernetes
To make sure your applications run smoothly and efficiently in Kubernetes, focus on implementing the best practices for Application Performance Monitoring (APM), that can help in detecting potential issues early. This also optimizes performance and maintains high availability. Here are some key strategies to follow for application performance monitoring:
1. Define Clear Monitoring Goals
Before you start using application performance monitoring in K8s, it’s really important what you want to keep an eye on. Common goals are keeping an eye on how apps are doing, finding out where they’re not working as well, making sure they’re always up and running, and catching any anomalies. Having clear goals makes it easier to pick the right tools and signs to watch out for.
2. Use Kubernetes-Native Tools
Kubernetes-native tools integrate seamlessly with your cluster, providing more accurate and detailed insights. Tools like Prometheus, Grafana, and Kubernetes Dashboard are specifically designed for Kubernetes environments and offer robust monitoring capabilities.
3. Monitor Key Metrics
Focus on monitoring key metrics that give you a clear picture of your application’s performance. Important metrics include:
- CPU and Memory Usage: Helps in understanding the resource consumption of your pods and nodes.
- Pod and Container Health: Monitors the status of pods and containers, including restarts and failures.
- Network Traffic: Tracks the data sent and received by your applications.
- Disk I/O: Measures the read and write operations on disk storage.
4. Set Up Alerts
Alerts notify you when something goes amiss, enabling you to address issues promptly. Configure alerts for crucial metrics like high CPU usage, memory leaks, or application errors. Tools like Prometheus Alertmanager can help set up and manage alerts effectively.
5. Use Distributed Tracing
Distributed tracing aids in monitoring requests as they traverse different services within your application. This is particularly useful in microservices architectures where a single request can touch multiple services. Tools such as Zipkin and Jaeger can help implement distributed tracing in Kubernetes.
6. Log Aggregation
Collect and centralize logs from all your containers and nodes. Logs provide valuable information for debugging and troubleshooting. Tools such as Elasticsearch, Kibana (EFK stack) and Fluentd are popular choices for log aggregation in Kubernetes.
7. Implement Service Mesh
A service mesh manages service-to-service communication, providing insights into network performance and security. Istio and Linkerd are popular service mesh tools that offer built-in monitoring and tracing capabilities.
8. Ensure Scalability
Your monitoring setup should scale with your Kubernetes cluster. As your application grows, your monitoring system should manage the increased load without leading to performance degradation. Ensure your monitoring tools are configured to scale automatically.
9. Regularly Review and Update Monitoring Setup
Monitoring needs to evolve over time. Regularly review your monitoring setup to ensure it meets your current requirements. Update your tools and configurations to incorporate new metrics, improve performance, and address any gaps.
Popular APM Tools for Kubernetes
Several tools can help you monitor your applications in Kubernetes effectively. Featured below are the most popular ones:
groundcover
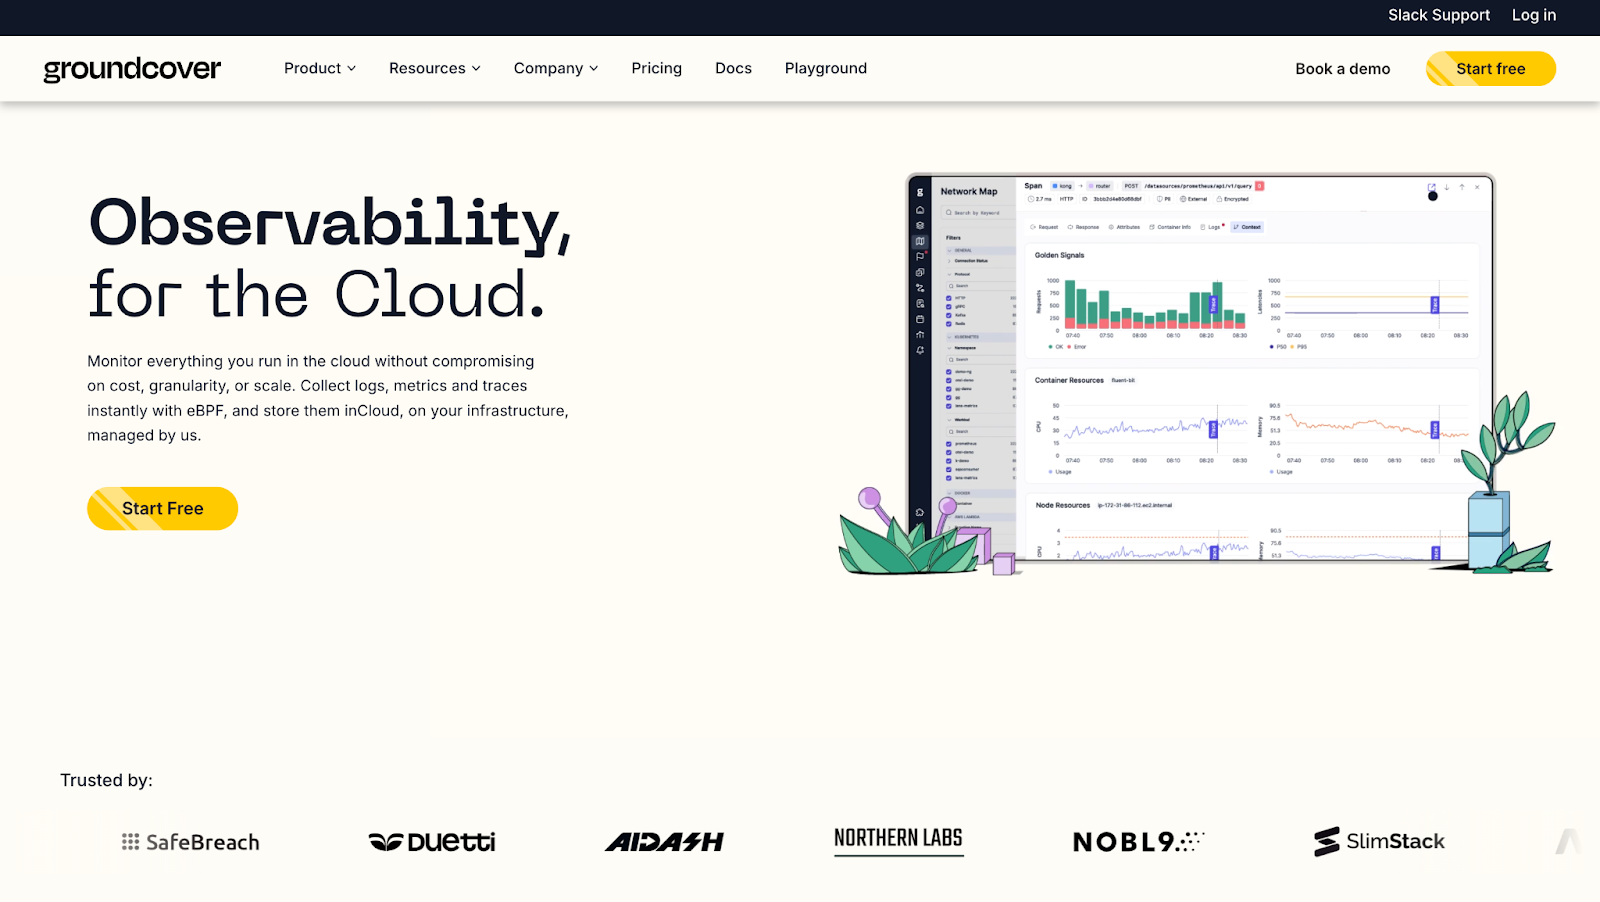
groundcover is a modern observability platform that focuses on providing deep, real-time insights into Kubernetes applications. It aims to simplify the complexity of monitoring and troubleshooting containerized environments by offering a comprehensive suite of tools and features designed for Kubernetes.
Features
- eBPF-Based Observability: groundcover leverages eBPF technology to collect high-resolution performance data directly from the Linux kernel. This approach allows for low-overhead monitoring, ensuring that the observability infrastructure does not impact application performance.
- Real-Time Metrics: The platform provides real-time, high-resolution metrics, enabling users to quickly identify and respond to performance issues.
- Automatic Anomaly Detection: groundcover includes advanced algorithms for detecting anomalies in system performance. This feature helps in proactively identifying potential issues before they impact end-users.
- Advanced Visualization and Analysis: groundcover offers powerful visualization tools that simplify the process of understanding complex performance data. Users can create custom dashboards and reports to monitor key metrics and trends.
Benefits
- Low Overhead: By leveraging eBPF, groundcover minimizes the performance impact on the monitored applications, making it suitable for high-performance environments.
- Comprehensive Insights: The platform provides a detailed view of application performance, enabling users to identify and troubleshoot issues quickly.
- Proactive Monitoring: With automatic anomaly detection, groundcover helps in catching potential problems early, reducing downtime, and improving reliability.
- Scalability: groundcover is designed to scale with your Kubernetes clusters, ensuring consistent performance monitoring as your application grows.
Prometheus
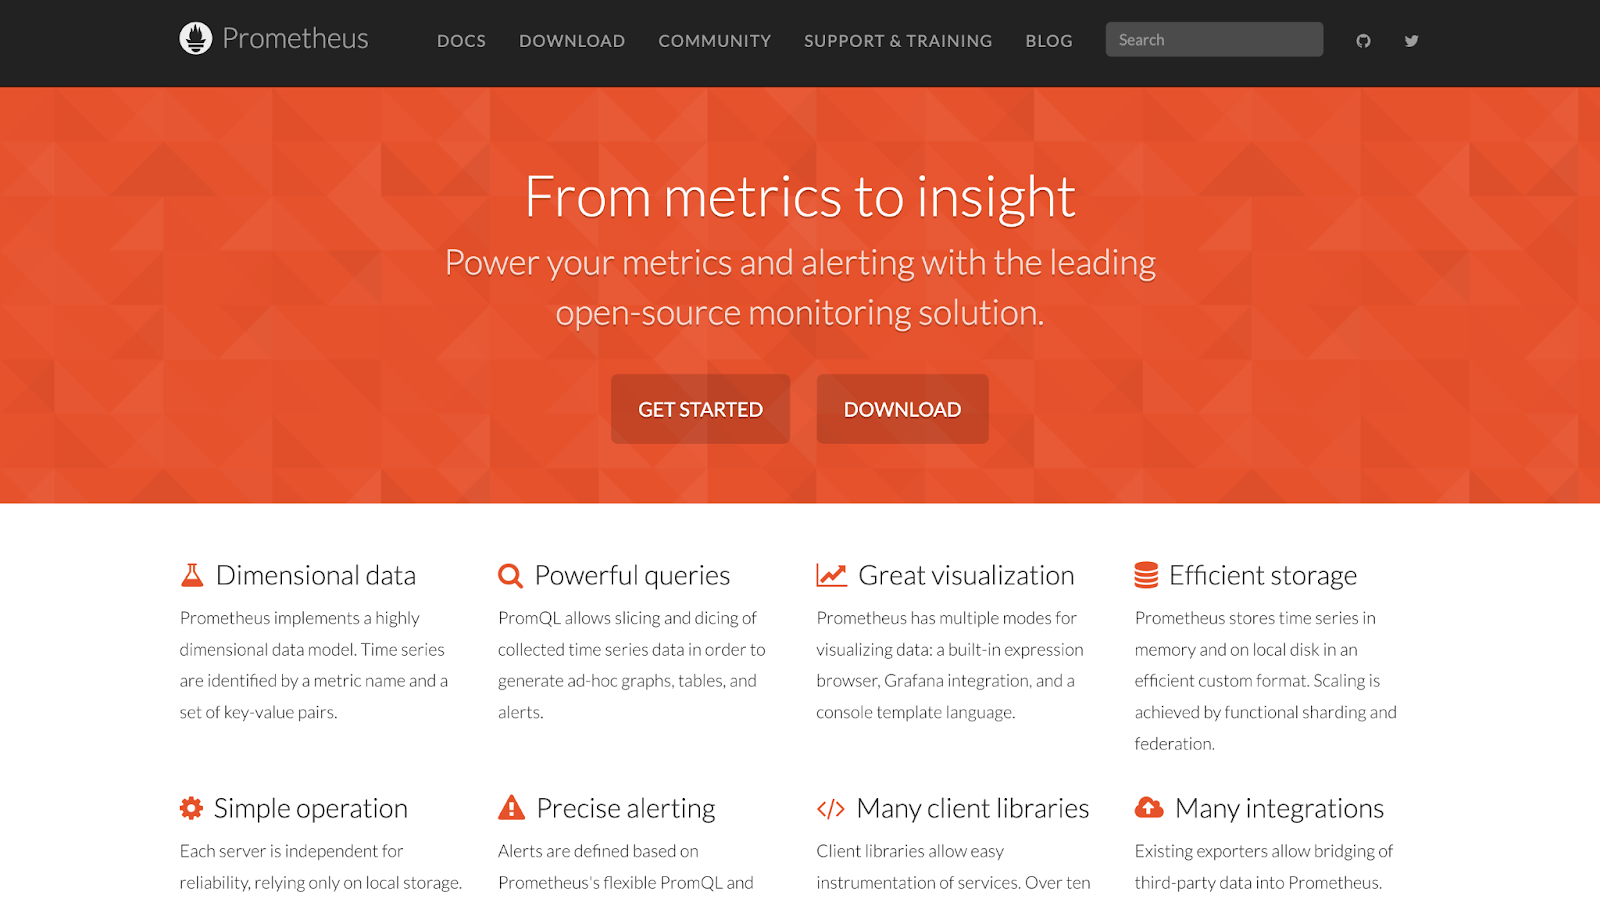
An open-source monitoring and alerting toolkit, Prometheus is designed for scalability and reliability. It collects metrics from various endpoints at specified intervals, evaluates rule expressions, and triggers alerts based on the defined conditions.
Features
- Powerful query language (PromQL)
- Multidimensional data model
- Alerting capabilities with Alertmanager
- Integration with Grafana for visualization
Benefits
- Scalability: Prometheus can handle large volumes of data and scale horizontally, making it suitable for growing environments.
- Flexibility: Its powerful query language, PromQL, allows for complex queries and data analysis.
- Community Support: As an open-source tool with a large community, Prometheus benefits from continuous improvements and a wealth of shared knowledge and resources.
Grafana
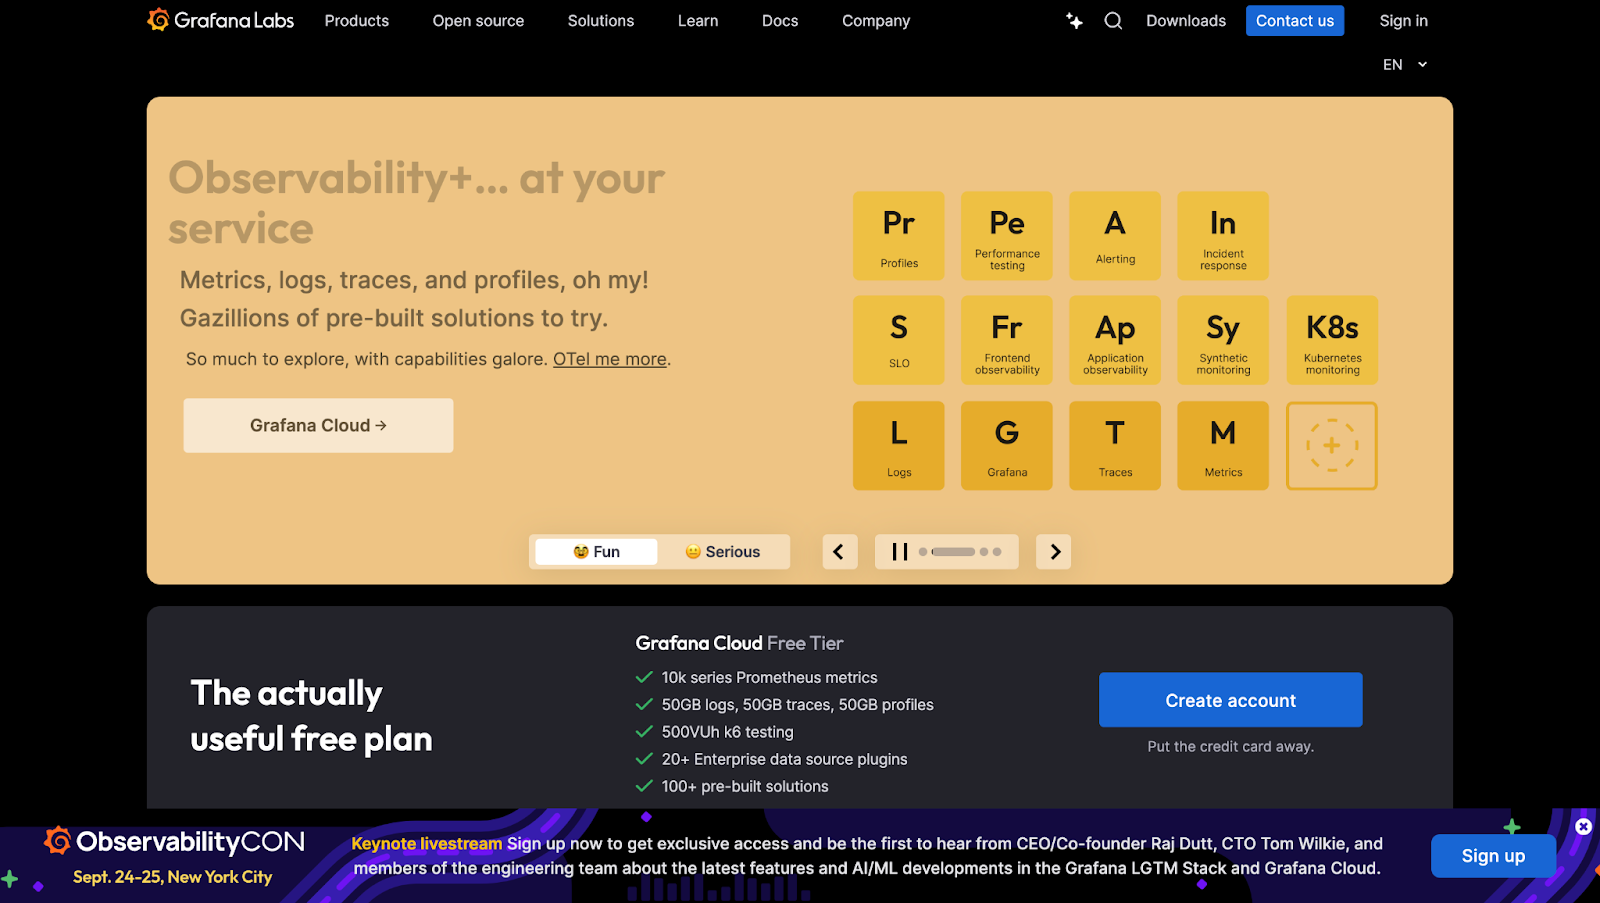
Grafana is an open-source platform for monitoring and observability. It provides a rich set of features for building, exploring, and sharing dashboards. Grafana integrates seamlessly with Prometheus, enabling users to visualize metrics and alerts effectively.
Features
- Customizable dashboards
- Support for multiple data sources
- Alerting and notification support
- Collaboration and sharing capabilities
Benefits
- User-Friendly Interface: Grafana offers an intuitive and customizable interface, making it easy to create and manage dashboards.
- Versatility: Supports a wide range of data sources, enabling a unified view of metrics from various systems.
- Collaboration: Facilitates team collaboration with shared dashboards and alerting, improving overall monitoring efficiency and response times.
Conclusion
Keeping an eye on how your applications are doing in Kubernetes is very important to make sure they work well and stay healthy. By using the best methods and tools, you can keep an eye on your Kubernetes setup, quickly find and fix problems, and make sure your applications are always available and performant. Tools like Prometheus, Grafana, etc. are some of the top choices for this. It’s also important to regularly check and change your monitoring setup to keep up with new needs and keep things running smoothly.