Open-sourced by Google in 2014, the Kubernetes project combines over 15 years of Google’s experience running production loads at scale while incorporating best ideas and practices from the community. Kubernetes is a portable, extensible platform that manages containerized workloads and services.
Kubernetes can work with almost any type of container runtime. It is also possible to deploy Kubernetes on any cloud infrastructure, public or private, as long as the host operating system is Windows or Linux.
Kubernetes is also highly portable as it can be used on various systems and environment configurations. Kubernetes goes above and beyond when it comes to multi-cloud flexibility. It can work with multi-cloud strategies to spread the workload across multiple clouds. With the help of Kubernetes, developers can deploy faster than ever while implementing a CI/CD pipeline.
Due to the ease of cloud deployment and software development on the cloud, most developers are moving to the cloud for application development. However, developing in Kubernetes presents some challenges, one of them being debugging. In most cases, the software development flow goes like this: write code, build a container, push it to registry, and redeploy. Not only is this flow slow, it also thwarts developers from benefiting from powerful debuggers. This is where debugging tools can be very useful.
Various methods of debugging are presented in the rest of this article.
Configuration Tools
There are a number of configuration orchestration tools like Terraform and AWS CloudFormation. There are also various configuration management tools, such as Ansible and Puppet, which can help you automate the deployment and configuration of complex applications. You can debug microservices such as Kubernetes and Docker with these tools to create a quick and seamless debugging environment.
Centralized Logging
Kubernetes can send logs to an external service. This way, all your logs can be at a single place when you need to investigate, trace, and find the root cause for a bug.
Dedicated Remote Debuggers for Kubernetes
There are many powerful open-source tools, such as Squash and Telepresence, that you can utilize with your local IDE (integrated development environment) debugger to debug your Kubernetes environment.
Squash builds a bridge between popular IDEs, such as IntelliJ, VSCode, and Eclipse, and deploys its clients on every Kubernetes node using a sidecar approach.
With this, developers can use all the available features of their local IDE debugger and powerful debuggers like Lightrun Cloud for live debugging, setting breakpoints, stepping through lines of code, and viewing and modifying variables of interest on the fly. Notably, it’s free-to-use for individual developers.
You can also use Telepresence for better performance. It operates quite differently. It debugs your local system while connecting it to a remote Kubernetes cluster. This allows you to develop/test your code locally and use any of your favorite IDE debuggers seamlessly.
This article will demonstrate how to conduct remote debugging for a Kubernetes Program using Lightrun Cloud.
Using Lightrun for Kubernetes Debugging
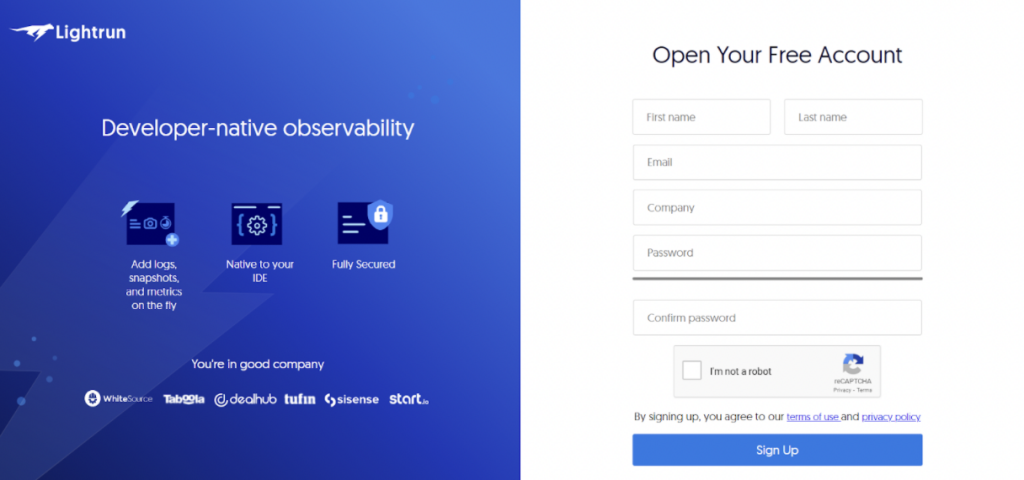
Step 1: Create a Lightrun Account
Go to the Lightrun website and create a new account. After you are signed up, you can use the login with Google option to log in easily.
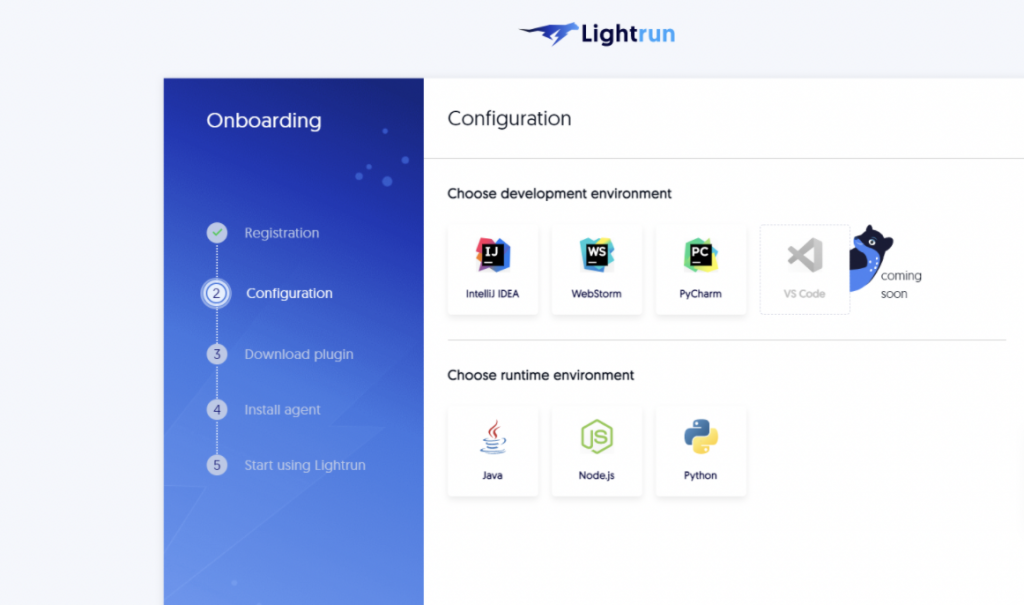
Step 2: Select Configuration
Once you are signed up and logged in, the following screen will come before you. Here, select IntelliJ IDEA and Java as a runtime.
Step 3: Installing the plugin
- In IntelliJ IDEA, choose Settings from the File menu. If you are using a Mac, choose Preferences from the IntelliJ menu.
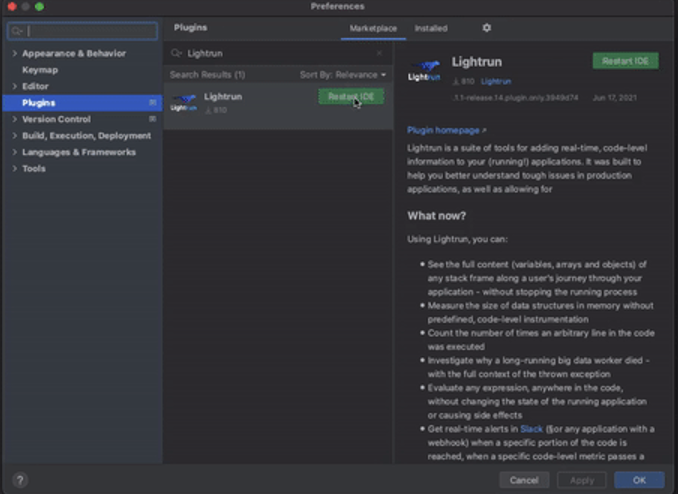
- In the Settings window, go to the Plugins tab, choose Marketplace, search for “Lightrun”, and click Install.
- In the window that opens, click on Restart IDE and wait for the changes to take effect.
- After the IDE restarts, log into the plugin by clicking the Login button in the plugin sidebar.
Step 4: Download Lightrun agent
After you are done installing the plugin in IntelliJ, move to Step 4 on the onboarding page of Lightrun and click on the Linux tab.
Use the following command to download the Lightrun agent.
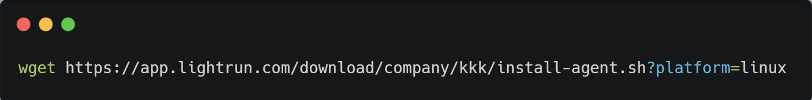
Here, replace the company name ‘kkk’ with the company name you used while signing up on Lightrun.
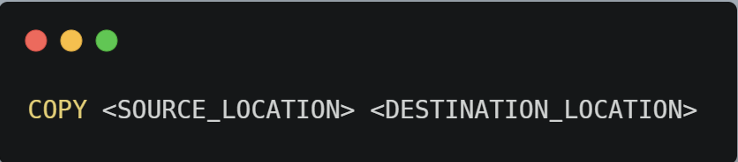
After downloading, add the COPY command to your docker file to copy the agent file inside your container.
Here, replace <Source_location> with the path of the agent file downloaded on your system and <Destination_location> with the path inside your container instance.
Take note of the Destination path inside the Kubernetes pod for the agent.
Step 5: Running the Java program
After your container is created and set up, open a command shell inside the container.
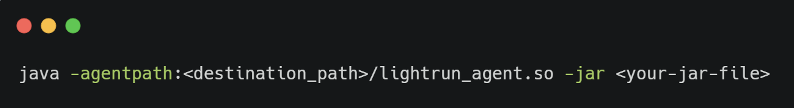
Run the following command while replacing Destination_Location with the path of the agent file inside your container, and replace your-jar-file with the jar executable of your Java program.
Congratulations! The Lightrun Remote Debugger is up and running in your Kubernetes Java production.
Conclusion
Even though setting up a remote Java debugger inside an existing Kubernetes production server seems like a daunting task, it actually takes only a couple of steps to set up. After that, you can make your task of managing both application and infrastructure easy and worry-free.